10 Ways To Celebrate Halloween With NASA
10 Ways to Celebrate Halloween with NASA
There’s a whole universe of mysteries out there to put some fun—and maybe a touch of fright—into your All Hallows Eve festivities. Here are a few:
1. Universe of Monsters
Mythical monsters of Earth have a tough time of it. Vampires don’t do sunlight. Werewolves must wait for a full Moon to howl. Now, thanks to powerful space telescopes, some careful looking and a lot of whimsy, NASA scientists have found suitable homes for the most terrifying Halloween monsters.

2. Be a Spacecraft
No costume. No problem. NASA Blueshift offers some handy tips on transforming yourself into a powerful space telescope before hitting the sidewalk to trick-or-treat.

3. Robot Pumpkins
At Halloween, engineers at NASA’s Jet Propulsion Laboratory craft dramatic creations that have as much in common with standard jack-o'-lanterns as paper airplanes do with NASA spacecraft. The unofficial pumpkin carving contest gives engineers a chance to flex their creative muscles and bond as a team. The rules are simple: no planning, carving or competing during work hours.
The results? See for yourself!
Can’t wait to see this year’s creations? Do it yourself!


4. Skull Comet
Scientists think a large space rock that zipped past Earth on Halloween in 2015 was most likely a dead comet or an asteroid that, fittingly, bore an eerie resemblance to a skull.
"The object might be a dead comet, but in the (radar) images it appears to have donned a skull costume for its Halloween flyby," said NASA scientist Kelly Fast,
As with a lot of spooky things, the asteroid looked a lot less scary upon closer inspection.

5. Spooky Sun
Not to be outdone, the Sun—our star—has been known to put on a scary face.
In this October 2014 Solar Dynamic Observatory image, active regions on the Sun combined to look something like a jack-o-lantern’s face.
The active regions appear brighter because those are areas that emit more light and energy—markers of an intense and complex set of magnetic fields hovering in the Sun’s atmosphere, the corona. This image blends together two sets of wavelengths at 171 and 193 angstroms, typically colorized in gold and yellow, to create a particularly Halloween-like appearance.

6. Halloween on a Mission
Halloween held a special significance for NASA’s Cassini mission, which launched in October 1997. The team held its own elaborate pumpkin carving competitions for many years. The mission also shared whimsical Halloween greetingswith its home planet.
Cassini ended its extended mission at Saturn in 2017.

7. The Ghost of Cassiopeia
The brightest stars embedded in nebulae throughout our galaxy pour out a torrent of radiation that eats into vast clouds of hydrogen gas – the raw material for building new stars. This etching process sculpts a fantasy landscape where human imagination can see all kinds of shapes and figures. This nebula in the constellation of Cassiopeia has flowing veils of gas and dust that have earned it the nickname "Ghost Nebula."

8. They’re Everywhere
Turns out the human mind—including space scientists and engineers among us—find spooky shapes in many places.
This infrared view of the Helix Nebula reminded astronomers of a zombie eyeball.

9. What Do You See?
The Oct. 26 Earth Observatory’s Puzzler feature offers a spooky shape for your consideration. What is it and what does it look like? You tell us.

10. Space Candy
The trick-or-treat tradition is still—so far—pretty much confined to Earth. But thanks to the men and women who have been living aboard the International Space Station for more than 17 years, we have a preview of what a future space-based trick-or-treater’s Halloween candy haul would look like in microgravity.

Bonus: 11. Want More?
Our education team offers a bunch more Halloween activities, including space-themed pumpkin stencils, costume tips and even some mysteries to solve like a scientist or engineer.

Make sure to follow us on Tumblr for your regular dose of space: http://nasa.tumblr.com.
More Posts from Nasa and Others

And that’s a wrap!! Thank you for all the wonderful questions in this Tumblr Answer Time, and we hope you learned a little something about what it takes to launch humans to space.
You can follow all of our latest Space Station news on Twitter, Instagram and Facebook.
Solar System: 5 Things To Know This Week
Our solar system is huge, so let us break it down for you. Here are 5 things to know this week:
1. Dancing with a Star

Our local star, better known as the sun, teems with activity. This month NASA has been tracking regions that burst with magnetic loops. The Solar Dynamics Observatory is one of several space-based assets that keep tabs on the sun daily, watching as charged particles trace the magnetic field, forming bright lines as they emit light in ultraviolet wavelengths.
2. An Idyll for Ida

On Nov. 24, the asteroid Ida makes its closest approach to Earth (at a very safe distance). Ida is the first asteroid found to have its own moon, and the second ever visited by a spacecraft. Its close encounter happened in 1993 as Galileo flew by en route to Jupiter.
3. Moonshine

On Nov. 23, the Cassini spacecraft will fly near Saturn's icy moon Tethys. Several instruments aboard Cassini will collect data, including an eight-frame color image mosaic. Between Nov. 27 and Dec. 2, Cassini will have very limited communications with Earth, because Cassini will enter solar conjunction, when Cassini and Saturn are on the other side of the Sun from Earth.
4. The Moon Will Occult Aldebaran

That may sound ominous, but all it means is that Earth's moon will pass in front of the giant red star Aldebaran on Nov. 26. Aldebaran is the bright "eye" of the constellation Taurus. The event will only be visible in some parts of North America. Details can be found HERE.
5. One Wild Ride, One Year Later

What a year it's been for the Rosetta mission since the Philae lander came to rest on the surface of Comet 67P/Churyumov-Gerasimenko in November 2014. A steady flow of data from the orbiter, together with several days of information sent from the lander, is providing a detailed picture of this remnant from the creation of the solar system.
Make sure to follow us on Tumblr for your regular dose of space: http://nasa.tumblr.com
3, 2, 1 LIFTOFF! Astronaut Kate Rubins is here answering your questions during this Tumblr Answer Time. Tune in and enjoy. 🚀👩🚀
A Space Starburst

Welcome to one of the most active galaxies in our cosmic neighborhood: NGC 1569. This starburst galaxy creates stars at a rate 100 times faster than in our own galaxy, the Milky Way – and it’s been doing so for the past 100 million years.
NGC 1569 is about 11 million light-years away in the constellation Camelopardalis. Find out more about this sparkling galaxy here.
For the past few weeks, our Hubble Space Telescope explored #GalaxiesGalore! You can find more galaxy content and spectacular new images on Hubble’s Twitter, Facebook, and Instagram.
Credit: NASA, ESA, the Hubble Heritage Team (STScI/AURA), and A. Aloisi (STScI/ESA)
What ways were used to determine all of the inner workings under our planet Earth’s surface?
10 Ground-breaking Earth Satellite Images from 2018
In 2018, our satellites captured beautiful imagery from throughout the solar system and beyond. However, some of our favorite visualizations are of this very planet. While this list is by no means exhaustive, it does capture some Earth satellite images from this year that are both visually striking as well as scientifically informative. This list also represents a broad variety of Earth’s features, as well as satellite instrumentation. Take a journey with our eyes in the sky!
10. Hurricane Florence

Before making landfall, Hurricane Florence churned in the Atlantic for a full two weeks — making it among the longest-lived cyclones of the 2018 season. When it finally did hit land on Sep. 14, the storm devastated the southeastern U.S. coast with intense winds, torrential rains and severe flooding.
This natural-color image was acquired by MODIS on the Terra Satellite on Sep. 12, 2018.
Images like this, as well as other satellite information, were used to anticipate the impact of the storm. Our Disasters Program created flood proxy maps that were shared with the Federal Emergency Management Agency (FEMA) and the National Guard to estimate how many and which communities would be most affected by the storm, in order to help prepare recovery efforts ahead of time.
9. Australia’s Lake Eyre Basin

The Lake Eyre Basin covers one-sixth of Australia and is one of the world’s largest internally draining river systems. However, the rivers supported by this system are ephemeral, meaning that they only run for short periods of time following unpredictable rain — the rest of the time, the Basin is a dry, arid desert.
However, when the heavy rain comes, the basin erupts in an explosion of green. In this false-color image captured by the Operational Land Imager (OLI) on Landsat 8 on Apr. 25, 2018, you can see how the vegetation completely envelops the spaces where the water has receded. (Flood water is indicated by light blue, and vegetation is indicated by light green.)
Satellites are an excellent tool for tracking greening events that are followed by flooding. These events offer opportunities for predictive tools as well as recreation.
8. Alaska’s Chukchi Sea

A Monet painting comes to life as the Chukchi Sea swirls with microscopic marine algae.
This image was captured off the Alaskan coast by OLI on Landsat 8 on Jun. 18, 2018. After the Arctic sea ice breaks up each spring, the nutrient-rich Bering Sea water mixes with the nutrient-poor Alaskan coastal water. Each type of water brings with it a different type of phytoplankton and the surface waters have just enough light for the algae to populate and flourish. The result is these mesmerizing patterns of turquoise and green.
This image represents one piece of much larger, incredibly complex ecosystem. While one would not normally associate the breaking up of sea ice with phytoplankton blooms, it is an intricate process of the phytoplankton life cycle. The size of the blooms have varied greatly from year to year, and experts are unsure why. Images like these can help scientists track the development of these blooms and link it to other environmental changes.
7. Hawaii’s Kilauea

Sometimes fresh lava is best viewed in infrared.
This false-color image of Kilauea, captured by OLI on Landsat 8 on May 23, 2018, shows the infrared signal emitted by lava flowing toward the sea. The purple areas surrounding the glowing lava are clouds lit from below, indicating that this image was taken through a break in the clouds.
The Puʻu ʻŌʻō Kupaianaha eruption has been continuously spewing red-hot lava since 1983, making it the longest eruption at Kilauea in recorded history. However, new fissures opened up this year that forced many to evacuate the area. Hawaii’s largest lake evaporated in hours and hundreds of homes were destroyed in Vacationland and Kapoho.
Imagery, seismometers and ground-based instruments were used to track the underground movement of magma. Infrared imagery can be incredibly helpful in disasters like this when you to view data that cannot be observed with the naked eye.
6. California’s Woolsey Burn Scar

Nothing quite encapsulates the destruction of a wildfire like a photo from outer space.
This image of the Woolsey Fire aftermath in Southern California was captured on Nov. 18, 2018 by the Advanced Spaceborned Thermal Emission and Reflection Radiometer (ASTER) on the Terra satellite. This false-color infrared image has been enhanced to clearly show the burned vegetation (indicated by brown) and the vegetation that survived unscathed (indicated by green).
The Woolsey Fire clearly left its mark, with almost 152 square miles (394 square km) and 88% of the Santa Monica Mountains National Recreation Area badly burned. Images like this one can assist fire managers in the area plan for recovery.
5. Bangladesh’s Padma River

As the years go by, the Padma River grows and shrinks, twists and turns. It never has a fixed shape, and as a result, thousands of people must regularly adapt to the constant changes in the river’s 75-mile (130-km) shoreline.
This image captured on Jan. 20, 2018 by OLI on Landsat 8 depicts one of the major rivers of Bangladesh. For thirty years, scientists have been tracking the erosion of the river with satellite imagery. Combinations of shortwave infrared, near infrared, and visible light are used to detect differences year-to-year in width, depth, and shape of the river. Sometimes the river splits off, but then rejoins again later. These patterns are created by the river carrying and depositing sediment, shaping the curves of the path of water.
Monitoring the Padma River is going to become especially important as a new bridge development project advances in the Char Janajat area. Although the bridge will most certainly help shorten travel times for citizens, nobody is quite sure how the river erosion might affect the construction and vice versa.
4. Alaska’s Yakutat Glacier

It’s hard to believe that Harlequin Lake was once all dry land — but it only started to form once Yakutat Glacier started melting. The lake appeared at the beginning of the twentieth century, and has been growing rapidly ever since.
In this hauntingly beautiful image, captured on Sep. 21 2018 by OLI on Landsat 8, the effect of climate change is apparent — especially when compared to earlier images of the region.
Unless the climate warming starts to reverse very soon — which scientists consider very unlikely — Yakutat could be gone as soon as 2070.
3. South Africa’s Theewaterskloof

Cape Town is a seaside city planted on the tip of South Africa. It’s a city known for its beaches and biodiversity — it also almost became known as the first major city to officially run out of water.
This image of Cape Town’s largest reservoir — Theewaterskloof — was acquired on Jul. 9th, 2018 by OLI on Landsat 8. By the time this photo was taken, the city’s main reservoirs stood at 55%. This was a huge increase from where it stood just six months earlier: just 13%.
The severe water shortage in the region started in 2015, only to become more threatening after three successive and unusually dry years. The entire city was preparing for Day Zero — the day the tap water would be shut off.
Despite forecasts that Day Zero would arrive in April, a combination of heavier rains and local conservation efforts restored the majority of the reservoir.
2. Aerosol Earth

Aerosols are all around us. From the smoke from a fire, to the dust in the wind to the salt in sea spray — these solid particles and liquid droplets are always swirling in our atmosphere, oftentimes unseen.
The Goddard Earth Observing System Forward Processing (GEOS FP) model uses mathematical equations to model what is happening in our atmosphere. The inputs for its equations — temperature, moisture, wind, etc. — come from our satellites and ground sensors.
This visualization was compiled on Aug. 24, 2018 — obviously a busy day for aerosols in our atmosphere. Swirls of sea salt (indicated by blue) reveal typhoons Soulik and Cimaron heading straight towards South Korea and Japan. A haze of black carbon (indicated by red) suffuse from agricultural burning in Africa and large wildfires in North America. And clouds of dust (indicated by purple) float off the Sahara desert.
1. Camp Fire

With nearly a hundred fatalities, hundreds of thousands of acres burned and billions of dollars of damage, the world watched in horror as Camp Fire grew to become the most destructive California wildfire in recorded history.
This image was captured on Nov. 8, 2018 by OLI on Landsat 8 on the same day Camp Fire ignited. It consolidates both visible light and shortwave-infrared light in order to highlight the active fire. Strong winds and dry conditions literally fanned the flames and spread this wildfire like a rash.
This image has not only become the iconic portrait for Camp Fire, it is also sobering representation of how quickly a fire can grow out of control in a short amount of time. Even from space, you can almost smell the massive plumes of smoke and feel the heat of the fires.
Whether you realize it or not, our Earth satellite missions are collecting data everyday in order to monitor environmental changes and prepare for natural disasters. If your interest is piqued by this list, head over to the Earth Observatory. The Earth Observatory updates daily with fresh, new content — brought to you by none other than our eyes in the sky.
Make sure to follow us on Tumblr for your regular dose of space: http://nasa.tumblr.com
Jessica, first of all, I love you. Second, what's it like being a part of the first class that was 50% female?
Thank you! The best part is that I think the fact that our class is 50% female simply reflects how far our society has come, and that is a great thing! To us, there really is no difference on whether or not we are female or male, what backgrounds we come from, etc., we are one team, one family, all contributing to the same cause (which is an extraordinary feeling!). I’m definitely very proud and honored to be part of the 21st astronaut class.
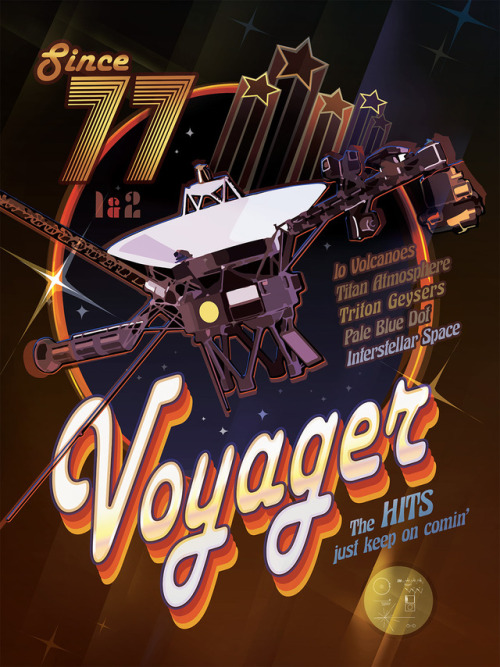
Thanks to the twin Voyager spacecraft, music is truly universal: Each carries a Golden Record with sights, sounds and songs from Earth as it sails on through the Milky Way. Recalling the classic rock era of the late 1970s when the Voyagers launched, this poster is an homage to the mission’s greatest hits. Some of the most extraordinary discoveries of the probes’ first 40 years include the volcanoes on Jupiter’s moon Io, the hazy nitrogen atmosphere of Saturn’s moon Titan and the cold geysers on Neptune’s moon Triton. Voyager 1 is also the first spacecraft to deliver a portrait of our planets from beyond Neptune, depicting Earth as a ‘pale blue dot,’ as of Aug. 25, 2012, to enter interstellar space. Voyager 2 is expected to enter interstellar space in the coming years. Even after 40 years, the Voyagers’ hits just keep on coming.
Enjoy this and other Voyager anniversary posters. Download them for free here: https://voyager.jpl.nasa.gov/downloads/
Credit: NASA/JPL-Caltech
Make sure to follow us on Tumblr for your regular dose of space: http://nasa.tumblr.com.
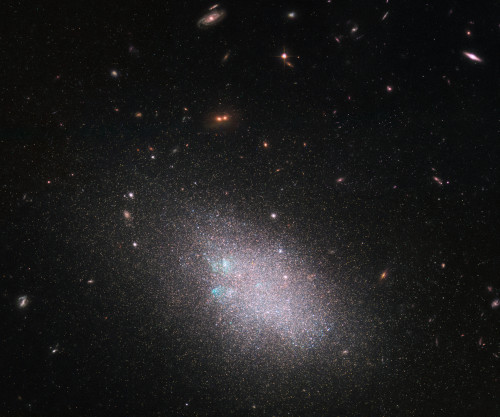
Look! A cosmic block party 🥳 In this Hubble image, you’ll find 50 spiral and dwarf galaxies hanging out in our cosmic neighborhood. The main focal point of stars is actually a dwarf galaxy. Dwarf galaxies often show a hazy structure, an ill-defined shape and an appearance somewhat akin to a swarm or cloud of stars — and UGC 685 is no exception to this. These data were gathered under Hubble’s Legacy ExtraGalactic UV Survey (LEGUS) program, the sharpest and most comprehensive ultraviolet survey of star-forming galaxies in the nearby universe. Image Credit: ESA/Hubble & NASA; the LEGUS team, B. Tully, D. Calzetti
Make sure to follow us on Tumblr for your regular dose of space: http://nasa.tumblr.com

Got a question about black holes? Let’s get to the bottom of these odd phenomena. Ask our black hole expert anything!
Black holes are mystifying yet terrifying cosmic phenomena. Unfortunately, people have a lot of ideas about them that are more science fiction than science. Don’t worry! Our black hole expert, Jeremy Schnittman, will be answering your your questions in an Answer Time session on Wednesday, October 2 from 3pm - 4 pm ET here on NASA’s Tumblr! Make sure to ask your question now by visiting http://nasa.tumblr.com/ask!
Jeremy joined the Astrophysics Science Division at our Goddard Space Flight Center in 2010 following postdoctoral fellowships at the University of Maryland and Johns Hopkins University. His research interests include theoretical and computational modeling of black hole accretion flows, X-ray polarimetry, black hole binaries, gravitational wave sources, gravitational microlensing, dark matter annihilation, planetary dynamics, resonance dynamics and exoplanet atmospheres. He has been described as a "general-purpose astrophysics theorist," which he regards as quite a compliment.

Fun Fact: The computer code Jeremy used to make the black hole animations we featured last week is called "Pandurata," after a species of black orchid from Sumatra. The name pays homage to the laser fusion lab at the University of Rochester where Jeremy worked as a high school student and wrote his first computer code, "Buttercup." All the simulation codes at the lab are named after flowers.
Make sure to follow us on Tumblr for your regular dose of space: http://nasa.tumblr.com
-
 eternal-immortal-forever liked this · 6 months ago
 -
 rodentia-noir liked this · 1 year ago
 -
 apricotsnow liked this · 2 years ago
 -
 oracleofthepast liked this · 3 years ago
 -
 tails-of-a-dragon-rider reblogged this · 3 years ago
 -
 mari-sunderland liked this · 3 years ago
 -
 odette0803 liked this · 4 years ago
 -
 ill-doit-anyway liked this · 4 years ago
 -
 greetings-from-the-suffer-puppet liked this · 4 years ago
 -
 thoughtfullyjoyfulkitty liked this · 4 years ago
 -
 mekhan1te liked this · 4 years ago
 -
 reichenbached221b reblogged this · 4 years ago
 -
 alimoony liked this · 4 years ago
 -
 mwritesstuff reblogged this · 4 years ago
 -
 stairwell-flowers reblogged this · 4 years ago
 -
 liptonrm reblogged this · 4 years ago
 -
 zealoustacosstuff liked this · 4 years ago
 -
 shukegap liked this · 4 years ago
 -
 damnation liked this · 4 years ago
 -
 gaygryffindor44 liked this · 4 years ago
 -
 creativefictionlover liked this · 4 years ago
 -
 aeternatus liked this · 4 years ago
 -
 minnathedemon liked this · 4 years ago
 -
 cerebral-halloween liked this · 4 years ago
 -
 strawberry-and-neon liked this · 4 years ago
 -
 obsessedwithaliens liked this · 4 years ago
 -
 well-shit-were-doomed liked this · 4 years ago
 -
 wilkpinthewillows liked this · 4 years ago
 -
 yufrow reblogged this · 4 years ago
 -
 toshawater liked this · 4 years ago
Explore the universe and discover our home planet with the official NASA Tumblr account
1K posts