Waspluto - Rie

More Posts from Waspluto and Others
this is your daily reminder to take a chonce
Sorry my posts haven't been as frequent or funny as usual. It's because I'm eating well, sleeping regularly, and exercising
If you're a young woman with emotions you gotta save em up so you can yell at your eldest daughter. If you're a young man with emotions you gotta go on a quest or some shit.
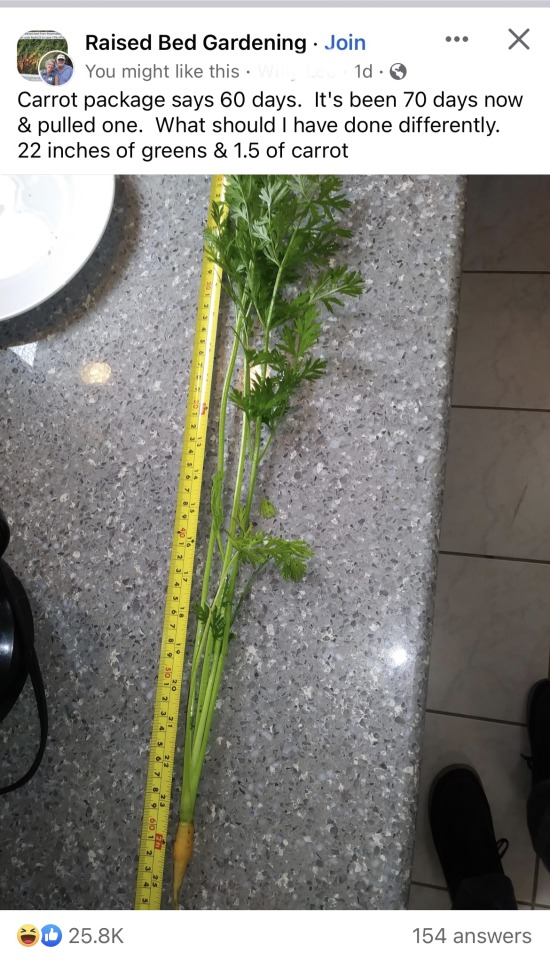
Fully losing it at this facebook screenshot. 22 inches of green and 1.5 of carrot.
time heals a whole lot and today is better than two years ago
Skip Google for Research
As Google has worked to overtake the internet, its search algorithm has not just gotten worse. It has been designed to prioritize advertisers and popular pages often times excluding pages and content that better matches your search terms
As a writer in need of information for my stories, I find this unacceptable. As a proponent of availability of information so the populace can actually educate itself, it is unforgivable.
Below is a concise list of useful research sites compiled by Edward Clark over on Facebook. I was familiar with some, but not all of these.
⁂
Google is so powerful that it “hides” other search systems from us. We just don’t know the existence of most of them. Meanwhile, there are still a huge number of excellent searchers in the world who specialize in books, science, other smart information. Keep a list of sites you never heard of.
www.refseek.com - Academic Resource Search. More than a billion sources: encyclopedia, monographies, magazines.
www.worldcat.org - a search for the contents of 20 thousand worldwide libraries. Find out where lies the nearest rare book you need.
https://link.springer.com - access to more than 10 million scientific documents: books, articles, research protocols.
www.bioline.org.br is a library of scientific bioscience journals published in developing countries.
http://repec.org - volunteers from 102 countries have collected almost 4 million publications on economics and related science.
www.science.gov is an American state search engine on 2200+ scientific sites. More than 200 million articles are indexed.
www.pdfdrive.com is the largest website for free download of books in PDF format. Claiming over 225 million names.
www.base-search.net is one of the most powerful researches on academic studies texts. More than 100 million scientific documents, 70% of them are free
I cannot BELIEVE you guys actually signing up to netflix just because account sharing was banned. You need to learn about cool websites with many beautiful women who would love you message you and send you downloadable files.
A Tour of Cosmic Temperatures
We often think of space as “cold,” but its temperature can vary enormously depending on where you visit. If the difference between summer and winter on Earth feels extreme, imagine the range of temperatures between the coldest and hottest places in the universe — it’s trillions of degrees! So let’s take a tour of cosmic temperatures … from the coldest spots to the hottest temperatures yet achieved.
First, a little vocabulary: Astronomers use the Kelvin temperature scale, which is represented by the symbol K. Going up by 1 K is the same as going up 1°C, but the scale begins at 0 K, or -273°C, which is also called absolute zero. This is the temperature where the atoms in stuff stop moving. We’ll measure our temperatures in this tour in kelvins, but also convert them to make them more familiar!
We’ll start on the chilly end of the scale with our CAL (Cold Atom Lab) on the International Space Station, which can chill atoms to within one ten billionth of a degree above 0 K, just a fraction above absolute zero.

Credit: NASA's Goddard Space Flight Center/Scott Wiessinger
Just slightly warmer is the Resolve sensor inside XRISM, pronounced “crism,” short for the X-ray Imaging and Spectroscopy Mission. This is an international collaboration led by JAXA (Japan Aerospace Exploration Agency) with NASA and ESA (European Space Agency). Resolve operates at one twentieth of a degree above 0 K. Why? To measure the heat from individual X-rays striking its 36 pixels!

Credit: NASA's Goddard Space Flight Center/Scott Wiessinger
Resolve and CAL are both colder than the Boomerang Nebula, the coldest known region in the cosmos at just 1 K! This cloud of dust and gas left over from a Sun-like star is about 5,000 light-years from Earth. Scientists are studying why it’s colder than the natural background temperature of deep space.

Credit: NASA's Goddard Space Flight Center/Scott Wiessinger
Let’s talk about some temperatures closer to home. Icy gas giant Neptune is the coldest major planet. It has an average temperature of 72 K at the height in its atmosphere where the pressure is equivalent to sea level on Earth. Explore how that compares to other objects in our solar system!

Credit: NASA's Goddard Space Flight Center/Scott Wiessinger
How about Earth? According to NOAA, Death Valley set the world’s surface air temperature record on July 10, 1913. This record of 330 K has yet to be broken — but recent heat waves have come close. (If you’re curious about the coldest temperature measured on Earth, that’d be 183.95 K (-128.6°F or -89.2°C) at Vostok Station, Antarctica, on July 21, 1983.)
We monitor Earth's global average temperature to understand how our planet is changing due to human activities. Last year, 2023, was the warmest year on our record, which stretches back to 1880.

Credit: NASA's Goddard Space Flight Center/Scott Wiessinger
The inside of our planet is even hotter. Earth’s inner core is a solid sphere made of iron and nickel that’s about 759 miles (1,221 kilometers) in radius. It reaches temperatures up to 5,600 K.

Credit: NASA's Goddard Space Flight Center/Scott Wiessinger
We might assume stars would be much hotter than our planet, but the surface of Rigel is only about twice the temperature of Earth’s core at 11,000 K. Rigel is a young, blue star in the constellation Orion, and one of the brightest stars in our night sky.

Credit: NASA's Goddard Space Flight Center/Scott Wiessinger
We study temperatures on large and small scales. The electrons in hydrogen, the most abundant element in the universe, can be stripped away from their atoms in a process called ionization at a temperature around 158,000 K. When these electrons join back up with ionized atoms, light is produced. Ionization is what makes some clouds of gas and dust, like the Orion Nebula, glow.

Credit: NASA's Goddard Space Flight Center/Scott Wiessinger
We already talked about the temperature on a star’s surface, but the material surrounding a star gets much, much hotter! Our Sun’s surface is about 5,800 K (10,000°F or 5,500°C), but the outermost layer of the solar atmosphere, called the corona, can reach millions of kelvins.
Our Parker Solar Probe became the first spacecraft to fly through the corona in 2021, helping us answer questions like why it is so much hotter than the Sun's surface. This is one of the mysteries of the Sun that solar scientists have been trying to figure out for years.

Credit: NASA's Goddard Space Flight Center/Scott Wiessinger
Looking for a hotter spot? Located about 240 million light-years away, the Perseus galaxy cluster contains thousands of galaxies. It’s surrounded by a vast cloud of gas heated up to tens of millions of kelvins that glows in X-ray light. Our telescopes found a giant wave rolling through this cluster’s hot gas, likely due to a smaller cluster grazing it billions of years ago.

Credit: NASA's Goddard Space Flight Center/Scott Wiessinger
Now things are really starting to heat up! When massive stars — ones with eight times the mass of our Sun or more — run out of fuel, they put on a show. On their way to becoming black holes or neutron stars, these stars will shed their outer layers in a supernova explosion. These layers can reach temperatures of 300 million K!

Credit: NASA's Goddard Space Flight Center/Jeremy Schnittman
We couldn’t explore cosmic temperatures without talking about black holes. When stuff gets too close to a black hole, it can become part of a hot, orbiting debris disk with a conical corona swirling above it. As the material churns, it heats up and emits light, making it glow. This hot environment, which can reach temperatures of a billion kelvins, helps us find and study black holes even though they don’t emit light themselves.
JAXA’s XRISM telescope, which we mentioned at the start of our tour, uses its supercool Resolve detector to explore the scorching conditions around these intriguing, extreme objects.

Credit: NASA's Goddard Space Flight Center/CI Lab
Our universe’s origins are even hotter. Just one second after the big bang, our tiny, baby universe consisted of an extremely hot — around 10 billion K — “soup” of light and particles. It had to cool for a few minutes before the first elements could form. The oldest light we can see, the cosmic microwave background, is from about 380,000 years after the big bang, and shows us the heat left over from these earlier moments.

Credit: NASA's Goddard Space Flight Center/Scott Wiessinger
We’ve ventured far in distance and time … but the final spot on our temperature adventure is back on Earth! Scientists use the Large Hadron Collider at CERN to smash teensy particles together at superspeeds to simulate the conditions of the early universe. In 2012, they generated a plasma that was over 5 trillion K, setting a world record for the highest human-made temperature.
Want this tour as a poster? You can download it here in a vertical or horizontal version!

Credit: NASA's Goddard Space Flight Center/Scott Wiessinger
Explore the wonderful and weird cosmos with NASA Universe on X, Facebook, and Instagram. And make sure to follow us on Tumblr for your regular dose of space!
I’m both pro herbal medicine and pro vaccination because you can treat burns with aloe vera juice and sore throats with lavender infused honey but you can’t rid a country of polio with plants.
space nerds and enthusiasts, it’s the moment you’ve been waiting for
(or at least- the moment I’VE been waiting for since jwst imaged jupiter)
the James Webb Space Telescope’s NIRCam has imaged Saturn for the first time, and it’s SO COOL!!


above are the two processed images, the lower having the visible moons and rings labeled, but there’s also some unprocessed images from jwst feed, which i think still look super cool, and just show what a world of a difference processing makes.


i think these images are SO cool, and i can’t wait to print them out to hang on my walls :)
-
 lvscinvs liked this · 1 month ago
 -
 aurentaie reblogged this · 1 month ago
 -
 judgementkazukun liked this · 1 month ago
 -
 parasiempretumelancolia reblogged this · 1 month ago
 -
parasiempretumelancolia liked this · 1 month ago
-
 eatmypuke liked this · 2 months ago
 -
 sublimecherryblossomobservation liked this · 3 months ago
 -
 corrfest liked this · 8 months ago
 -
 devoiddean liked this · 10 months ago
 -
 emdulhwelsjzka liked this · 11 months ago
 -
 65mystery liked this · 11 months ago
 -
 mayqween liked this · 1 year ago
 -
 xneverendingdream liked this · 1 year ago
 -
 panettonegk liked this · 1 year ago
 -
 tomatoandsoulsoup liked this · 1 year ago
 -
 ryureallla liked this · 1 year ago
 -
 loudwizardenthusiast liked this · 1 year ago
 -
 moonstared reblogged this · 1 year ago
 -
moonstared liked this · 1 year ago
-
 misterihenes liked this · 1 year ago
 -
 softlylovingsstuff liked this · 1 year ago
 -
 dissoziation reblogged this · 1 year ago
 -
 biz-bittik reblogged this · 1 year ago
 -
biz-bittik liked this · 1 year ago
-
 nottblessed reblogged this · 1 year ago
 -
nottblessed liked this · 1 year ago
-
 idontwannaplayy liked this · 1 year ago
 -
 nufcedsince71 liked this · 1 year ago
 -
 amoreforlife liked this · 1 year ago
 -
 1kermit liked this · 1 year ago
 -
 rabeyaarpita reblogged this · 1 year ago
 -
 fuzzypoetrystarlight liked this · 1 year ago
 -
 0diagnonsense0 liked this · 1 year ago
 -
 waywardpie liked this · 1 year ago
 -
 speaking-sycophant reblogged this · 1 year ago
 -
 madphantom liked this · 1 year ago
 -
 patakhaaguddii liked this · 1 year ago
 -
 hypnocreatorlawyershark liked this · 1 year ago
 -
 netbrutality reblogged this · 1 year ago
 -
 mourning-the-dove liked this · 1 year ago
 -
 dancerofmidnightstorm liked this · 1 year ago
 -
 fickle-minded-heart-3d reblogged this · 1 year ago
 -
 sedxctive liked this · 1 year ago
 -
 midnightepiphany liked this · 1 year ago
 -
 joonchld liked this · 1 year ago
 -
 jupitaajones liked this · 1 year ago
 -
 the-eend reblogged this · 1 year ago

an extraordinarily ordinary human being who exists, that's it. idk much about myself either so
47 posts