We Just Identified More Than 200 New (Potential) Planets
We Just Identified More Than 200 New (Potential) Planets
The Kepler space telescope is our first mission capable of identifying Earth-size planets around other stars. On Monday, June 19, 2017, scientists from many countries gathered at our Ames Research Center to talk about the latest results from the spacecraft, which include the identification of more than 200 potential new worlds! Here’s what you need to know:
We found 219 new planet candidates.

All of these worlds were found in a patch of sky near the Cygnus constellation in our Milky Way galaxy. Between 2009 and 2013, Kepler searched more than 200,000 stars in the region for orbiting planets. The 219 new planet candidates are part of the more than 4,000 planet candidates and 2,300 confirmed planets Kepler has identified to date.
Ten of these worlds are like our own.

Out of the 219 new planet candidates, 10 are possibly rocky, terrestrial worlds and orbit their star in the habitable zone – the range of distances from a star where liquid water could pool on the surface of a rocky planet.
Small planets come in two sizes.

Kepler has opened up our eyes to the existence of many small worlds. It turns out a lot of these planets are either approximately 1.5 times the size of Earth or just smaller than Neptune. The cool names given to planets of these sizes? Super Earths and mini-Neptunes.
Some of the new planets could be habitable.

Water is a key ingredient to life as we know it. Many of the new planet candidates are likely to have small rocky cores enveloped by a thick atmosphere of hydrogen and helium, and some are thought to be ocean worlds. That doesn’t necessarily mean the oceans of these planets are full of water, but we can dream, can’t we?
Other Earths are out there.

Kepler’s survey has made it possible for us to measure the number of Earth-size habitable zone planets in our galaxy. Determining how many planets like our own that exist is the big question we’ll explore next.
The hunt for new planets continues.

Kepler continues to search for planets in different regions of space. With the launch of our Transiting Exoplanet Survey Satellite (TESS) and the James Webb Space Telescope (JWST) in 2018, we’re going to search for planets nearest the sun and measure the composition of their atmospheres. In the mid-2020s, we have our sights on taking a picture of small planets like Earth with our Wide-Field Infrared Survey Telescope (WFIRST).
*All images of planets are artist illustrations.
Make sure to follow us on Tumblr for your regular dose of space: http://nasa.tumblr.com
More Posts from Carlosalberthreis and Others
The Moon in Motion
Happy New Year! And happy supermoon! Tonight, the Moon will appear extra big and bright to welcome us into 2018 – about 6% bigger and 14% brighter than the average full Moon. And how do we know that? Well, each fall, our science visualizer Ernie Wright uses data from the Lunar Reconnaissance Orbiter (LRO) to render over a quarter of a million images of the Moon. He combines these images into an interactive visualization, Moon Phase and Libration, which depicts the Moon at every day and hour for the coming year.
Want to see what the Moon will look like on your birthday this year? Just put in the date, and even the hour (in Universal Time) you were born to see your birthday Moon.
Our Moon is quite dynamic. In addition to Moon phases, our Moon appears to get bigger and smaller throughout the year, and it wobbles! Or at least it looks that way to us on Earth. This wobbling is called libration, from the Latin for ‘balance scale’ (libra). Wright relies on LRO maps of the Moon and NASA orbit calculations to create the most accurate depiction of the 6 ways our Moon moves from our perspective.
1. Phases

The Moon phases we see on Earth are caused by the changing positions of the Earth and Moon relative to the Sun. The Sun always illuminates half of the Moon, but we see changing shapes as the Moon revolves around the Earth. Wright uses a software library called SPICE to calculate the position and orientation of the Moon and Earth at every moment of the year. With his visualization, you can input any day and time of the year and see what the Moon will look like!
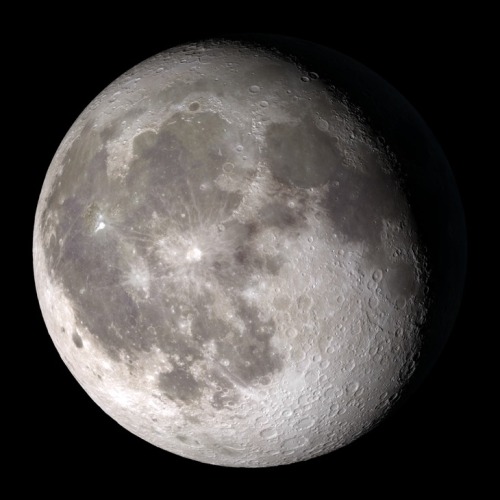
2. Shape of the Moon

Check out that crater detail! The Moon is not a smooth sphere. It’s covered in mountains and valleys and thanks to LRO, we know the shape of the Moon better than any other celestial body in the universe. To get the most accurate depiction possible of where the sunlight falls on the lunar surface throughout the month, Wright uses the same graphics software used by Hollywood design studios, including Pixar, and a method called ‘raytracing’ to calculate the intricate patterns of light and shadow on the Moon’s surface, and he checks the accuracy of his renders against photographs of the Moon he takes through his own telescope.

3. Apparent Size

The Moon Phase and Libration visualization shows you the apparent size of the Moon. The Moon’s orbit is elliptical, instead of circular - so sometimes it is closer to the Earth and sometimes it is farther. You’ve probably heard the term “supermoon.” This describes a full Moon at or near perigee (the point when the Moon is closest to the Earth in its orbit). A supermoon can appear up to 14% bigger and brighter than a full Moon at apogee (the point when the Moon is farthest from the Earth in its orbit).
Our supermoon tonight is a full Moon very close to perigee, and will appear to be about 14% bigger than the July 27 full Moon, the smallest full Moon of 2018, occurring at apogee. Input those dates into the Moon Phase and Libration visualization to see this difference in apparent size!
4. East-West Libration
Over a month, the Moon appears to nod, twist, and roll. The east-west motion, called ‘libration in longitude’, is another effect of the Moon’s elliptical orbital path. As the Moon travels around the Earth, it goes faster or slower, depending on how close it is to the Earth. When the Moon gets close to the Earth, it speeds up thanks to an additional pull from Earth’s gravity. Then it slows down, when it’s farther from the Earth. While this speed in orbital motion changes, the rotational speed of the Moon stays constant.
This means that when the Moon moves faster around the Earth, the Moon itself doesn’t rotate quite enough to keep the same exact side facing us and we get to see a little more of the eastern side of the Moon. When the Moon moves more slowly around the Earth, its rotation gets a little ahead, and we see a bit more of its western side.
5. North-South Libration

The Moon also appears to nod, as if it were saying “yes,” a motion called ‘libration in latitude’. This is caused by the 5 degree tilt of the Moon’s orbit around the Earth. Sometimes the Moon is above the Earth’s northern hemisphere and sometimes it’s below the Earth’s southern hemisphere, and this lets us occasionally see slightly more of the northern or southern hemispheres of the Moon!
6. Axis Angle

Finally, the Moon appears to tilt back and forth like a metronome. The tilt of the Moon’s orbit contributes to this, but it’s mostly because of the 23.5 degree tilt of our own observing platform, the Earth. Imagine standing sideways on a ramp. Look left, and the ramp slopes up. Look right and the ramp slopes down.
Now look in front of you. The horizon will look higher on the right, lower on the left (try this by tilting your head left). But if you turn around, the horizon appears to tilt the opposite way (tilt your head to the right). The tilted platform of the Earth works the same way as we watch the Moon. Every two weeks we have to look in the opposite direction to see the Moon, and the ground beneath our feet is then tilted the opposite way as well.
So put this all together, and you get this:
Beautiful isn’t it? See if you can notice these phenomena when you observe the Moon. And keep coming back all year to check on the Moon’s changing appearance and help plan your observing sessions.
Follow @NASAMoon on Twitter to keep up with the latest lunar updates.
Make sure to follow us on Tumblr for your regular dose of space: http://nasa.tumblr.com.
Infrared is Beautiful
Why was James Webb Space Telescope designed to observe infrared light? How can its images hope to compare to those taken by the (primarily) visible-light Hubble Space Telescope? The short answer is that Webb will absolutely capture beautiful images of the universe, even if it won’t see exactly what Hubble sees. (Spoiler: It will see a lot of things even better.)

The James Webb Space Telescope, or Webb, is our upcoming infrared space observatory, which will launch in 2019. It will spy the first luminous objects that formed in the universe and shed light on how galaxies evolve, how stars and planetary systems are born, and how life could form on other planets.
What is infrared light?
This may surprise you, but your remote control uses light waves just beyond the visible spectrum of light—infrared light waves—to change channels on your TV.
Infrared light shows us how hot things are. It can also show us how cold things are. But it all has to do with heat. Since the primary source of infrared radiation is heat or thermal radiation, any object that has a temperature radiates in the infrared. Even objects that we think of as being very cold, such as an ice cube, emit infrared.
There are legitimate scientific reasons for Webb to be an infrared telescope. There are things we want to know more about, and we need an infrared telescope to learn about them. Things like: stars and planets being born inside clouds of dust and gas; the very first stars and galaxies, which are so far away the light they emit has been stretched into the infrared; and the chemical fingerprints of elements and molecules in the atmospheres of exoplanets, some of which are only seen in the infrared.
In a star-forming region of space called the ‘Pillars of Creation,’ this is what we see with visible light:

And this is what we see with infrared light:

Infrared light can pierce through obscuring dust and gas and unveil a more unfamiliar view.
Webb will see some visible light: red and orange. But the truth is that even though Webb sees mostly infrared light, it will still take beautiful images. The beauty and quality of an astronomical image depends on two things: the sharpness of the image and the number of pixels in the camera. On both of these counts, Webb is very similar to, and in many ways better than, Hubble. Webb will take much sharper images than Hubble at infrared wavelengths, and Hubble has comparable resolution at the visible wavelengths that Webb can see.

Webb’s infrared data can be translated by computer into something our eyes can appreciate – in fact, this is what we do with Hubble data. The gorgeous images we see from Hubble don’t pop out of the telescope looking fully formed. To maximize the resolution of the images, Hubble takes multiple exposures through different color filters on its cameras.
The separate exposures, which look black and white, are assembled into a true color picture via image processing. Full color is important to image analysis of celestial objects. It can be used to highlight the glow of various elements in a nebula, or different stellar populations in a galaxy. It can also highlight interesting features of the object that might be overlooked in a black and white exposure, and so the images not only look beautiful but also contain a lot of useful scientific information about the structure, temperatures, and chemical makeup of a celestial object.
This image shows the sequences in the production of a Hubble image of nebula Messier 17:

Here’s another compelling argument for having telescopes that view the universe outside the spectrum of visible light – not everything in the universe emits visible light. There are many phenomena which can only be seen at certain wavelengths of light, for example, in the X-ray part of the spectrum, or in the ultraviolet. When we combine images taken at different wavelengths of light, we can get a better understanding of an object, because each wavelength can show us a different feature or facet of it.
Just like infrared data can be made into something meaningful to human eyes, so can each of the other wavelengths of light, even X-rays and gamma-rays.
Below is an image of the M82 galaxy created using X-ray data from the Chandra X-ray Observatory, infrared data from the Spitzer Space Telescope, and visible light data from Hubble. Also note how aesthetically pleasing the image is despite it not being just optical light:

Though Hubble sees primarily visible light, it can see some infrared. And despite not being optimized for it, and being much less powerful than Webb, it still produced this stunning image of the Horsehead Nebula.

It’s a big universe out there – more than our eyes can see. But with all the telescopes now at our disposal (as well as the new ones that will be coming online in the future), we are slowly building a more accurate picture. And it’s definitely a beautiful one. Just take a look…
…At this Spitzer infrared image of a shock wave in dust around the star Zeta Ophiuchi.

…this Spitzer image of the Helix Nebula, created using infrared data from the telescope and ultraviolet data from the Galaxy Evolution Explorer.

…this image of the “wing” of the Small Magellanic Cloud, created with infrared data from Spitzer and X-ray data from Chandra.

…the below image of the Milky Way’s galactic center, taken with our flying SOFIA telescope. It flies at more than 40,000 feet, putting it above 99% of the water vapor in Earth’s atmosphere– critical for observing infrared because water vapor blocks infrared light from reaching the ground. This infrared view reveals the ring of gas and dust around a supermassive black hole that can’t be seen with visible light.

…and this Hubble image of the Mystic Mountains in the Carina Nebula.

Learn more about the James Webb Space Telescope HERE, or follow the mission on Facebook, Twitter and Instagram.
Image Credits Eagle Nebula: NASA, ESA/Hubble and the Hubble Heritage Team Hubble Image Processing - Messier 17: NASA/STScI Galaxy M82 Composite Image: NASA, CXC, JHU, D.Strickland, JPL-Caltech, C. Engelbracht (University of Arizona), ESA, and The Hubble Heritage Team (STScI/AURA) Horsehead Nebula: NASA, ESA, and The Hubble Heritage Team (STScI/AURA) Zeta Ophiuchi: NASA/JPL-Caltech Helix Nebula: NASA/JPL-Caltech Wing of the Small Magellanic Cloud X-ray: NASA/CXC/Univ.Potsdam/L.Oskinova et al; Optical: NASA/STScI; Infrared: NASA/JPL-Caltech Milky Way Circumnuclear Ring: NASA/DLR/USRA/DSI/FORCAST Team/ Lau et al. 2013 Mystic Mountains in the Carina Nebula: NASA/ESA/M. Livio & Hubble 20th Anniversary Team (STScI)
Make sure to follow us on Tumblr for your regular dose of space: http://nasa.tumblr.com.


Pegue carona nessa cauda de cometa! !! Cometa Lovejoy fotografado pelos astronautas da Expedição 30 na ISS
Você Nunca Esteve Sozinha
Um jeito diferente de expressar.
Sempre firme com os seus princípios.
Fez o povo se encantar.
Por isso eu concordo e afirmo:
"Fenômenos não se explicam, fenômenos se admiram!"
#VocêNuncaEsteveSozinha #TeamJuliette #JulietteFreire #Globoplay


O que está acontecendo com o Sol? Algumas vezes parece que estamos vendo o Sol através de uma lente gignatesca, contudo, na verdade, estamos vendo ele através de milhões de pequenas lentes, os cristais de gelo. A água pode se congelar na atmosfera formando pequenos, achatados cristais de gelo hexagonais. Quando esses cristais flutuam, a maior parte do tempo eles passam com suas faces achatadas e parelelas ao solo. Um observador pode se encontrar no mesmo plano dos cristais de gelo perto do nascer ou do pôr do Sol. Durante esse alinhamento, cada cristal pode agir como uma lente em miniatura, refratando a luz do Sol e criando um fenômeno chamado de parélio, ou sundog. O vídeo acima foi feito a um mês atrás numa região perto de Estocolmo, na Suécia que é uma estação de ski e é conhecida como Vamdalen Ski Resort. Bem no centro está o Sol, enquanto que os proeminentes sundogs brilham à esquerda e à direita dele. Também visível nesse vídeo está o halo de 22 graus, bem como o mais raro e mais apagado, halo de 46 graus, halos esses que também são criados pela reflexão do Sol nos cristais de gelo na atmosfera.
Fonte:
https://apod.nasa.gov/apod/ap180101.html
Arte Da Natureza

📅 Data de registro: 5 de agosto de 2024 às 18:26
E a descoberta de exoplanetas continua, bem, isso é meio óbvio, aliás, é uma das áreas mais prolíficas da astronomia atualmente em grandes descobertas.
Dessa vez uma equipe internacional de astrônomos detectou 3 exoplanetas num sistema estelar binário formado por estrelas gêmeas.
O sistema estelar HD 133131 está localizado a aproximadamente 163 anos-luz de distância da Terra, é um sistema binário que foi descoberto em 1972, tem uma idade estimada de 9.5 bilhões de anos e é formado por duas estrelas gêmeas, ou seja, de mesmo tipo espectral, e que são também do mesmo tipo espectral que o Sol, G2V.
As estrelas estão separadas por 360 UA.
Tudo isso faz desse sistema, primeiro, o formado por estrelas mais próximas onde foram descobertos exoplanetas, e além disso, ambas as estrelas do sistema possuem planetas.
Uma das estrelas possui dois planetas com massas 0.6 e 1.4 vezes a massa de Júpiter e a outra estrela possui um planetas com uma massa 2.5 vezes a massa de Júpiter, ou seja, todos são planetas gigantes.
Mas esse sistema possui mais características peculiares.
As estrelas desse sistema são classificadas como sendo pobres em metal, ou seja, são formadas principalmente por hidrogênio e hélio, isso é incomum em estrelas que abrigam planetas gigantes, já que a maioria é rica em metal e somente 6 sistemas binários pobres em metal foram encontrados com exoplanetas, o que deixa a descoberta mais intrigante.
Já não bastasse tudo isso, ao estudar o sistema em detalhe, os astrônomos descobriram que as estrelas na verdade, possuem uma pequena diferença química na sua composição, o que deixaria de fazer com que elas fossem gêmeas idênticas, e passassem então a serem classificadas somente como gêmeas.
Essa diferenciação pode indicar que uma estrela pode ter engolido planetas menores ainda em formação e isso alterou sua composição química, levemente.
Essa descoberta marcou também a primeira descoberta feita somente com dados obtidos pelo instrumento Planet Finder Spectrograph, que fica acoplado ao Telescópio Magellan II de 6.5 metros no Observatório de Las Campanas no Chile.
Descobrir um sistema tão único assim é de suma importância para se entender a formação de planetas especialmente em sistemas binários.
Ajudar a montar o quebra cabeça de como o Sistema Solar se formou e de alguma forma ajudar os astrônomos a compreender onde planetas possivelmente habitáveis poderiam ser encontrados.
(via https://www.youtube.com/watch?v=GHMfsc0BFj4)
Detectando Ondas Gravitacionais Com a Missão GAIA - Space Today TV Ep.1057
As ondas gravitacionais, para quem ainda não sabe, tem um espectro, assim como a radiação eletromagnética tem o seu.
Esse espectro é chamado de espectro gravitacional.
Dentro do espectro gravitacional, atualmente, com o LIGO e VIRGO nós só conseguimos detectar ondas gravitacionais provenientes da fusão de buracos negros de massa estelar e da fusão de estrelas de nêutrons.
Essas, digamos, são ondas gravitacionais com frequências mais altas.
Mas lógico que existe a ideia e a vontade de se detectar ondas gravitacionais de frequências baixas.
Essas são produzidas, por exemplo, pela colisão de buracos negros supermassivos.
Nós já avançamos um pouco nesse sentido, já que a tecnologia da LISA, um detector espacial nos moldes do LIGO já foi testada e promete funcionar.
Existe também, como já falei aqui a técnica de usar os pulsares, a chamada Pulsar Timing Array.
Essa técnica é interessante, pois ela usa a observação dos pulsares, e calcula a mudança na frequência aparente dos pulsos com relação à passagem de uma onda gravitacional, gerada pela fusão de buracos negros supermassivos, por exemplo.
com base nessa ideia, um grupo de astrofísicos está propondo algo maravilhoso.
Eles querem usar a missão GAIA, da Agência Espacial Europeia, que mede com precisão a posição de bilhões de estrelas na Via Láctea como um detector de ondas gravitacionais de baixa frequência.
Para isso, a ideia é usar não a variação de pulsos dos pulsares, mas sim a aparente modificação na posição das estrelas observadas pela GAIA, ou seja, suas oscilações para detectar as ondas gravitacionais.
A passagem de uma onda gravitacional, que acaba causando uma oscilação no tecido do espaço-tempo, muda a posição das estrelas, a polarização da onda gravitacional pode ser detectada e assim teríamos a detecção de um tipo novo de onda gravitacional.
A vantagem é que a missão GAIA já está em funcionamento no espaço, já faz essas medidas, ou seja, essa aplicação pode ser testada a qualquer momento.
Os astrônomos realmente viram que o estudo das ondas gravitacionais pode trazer muitos novos conhecimentos sobre o universo, e entender os buracos negros supermassivos é algo que os deixa muito animados.
Vamos aguardar por novidades nessa área.
Hoje vamos falar um pouco de Urano.
Urano, as vezes é considerado como o paneta esquecido do nosso Sistema Solar, ele está muito longe, foi visitado só uma vez por uma sonda em 1986, pela Voyager II.
Urano é o sétimo planeta em distância do Sol, e o terceiro maior em tamanho, perdendo somente para Júptier e Saturno.
Urano possuem finos anéis de poeira e um conjunto incrível de 27 luas que nós conhecemos até hoje.
Na verdade é um pouco ridículo não termos tanto interesse assim, nesse grande planeta do nosso Sistema Solar.
Para vocês terem uma ideia, sabemos mais de Plutão e temos imagens mais detalhadas de Plutão do que de Urano.
Talvez o aspecto mais estranho de Urano seja a sua inclinação. Ele praticamente gira deitado.
Na verdade todos os planetas do Sistema Solar têm uma inclinação, a da Terra é de 23.5 graus, de Marte, 25 graus, e até Mercúrio tem uma inclinação de 2.1 graus.
Agora Urano, tem uma inclinação do eixo de rotação de 97.8 graus.
A grande questão então é, o que teria acontecido com Urano, para ter uma inclinação tão grande assim?
Para entender isso, teremos que voltar no início da história do Sistema Solar. A nossa vizinhança era um lugar bem violento e não muito amigável de se viver.
Muitas colisões aconteciam, entre corpos gigantescos, colisões catastróficas, vide a colisão da Terra com um corpo quase do tamanho de Marte que gerou a nossa Lua.
As colisões eram tão violentas, que os planetas mudavam de órbita, outros eram expulsos do Sistema Solar e outros mergulhavam diretamente na direção do Sol.
Com Urano, certamente aconteceu isso, uma colisão violenta que fez com que ele se inclinasse, e essa colisão aconteceu quando ele ainda estava circundado pelo disco de poeira que deu origem às suas luas, e nós sabemos disso, pois as luas orbitam Urano na mesma inclinação do seu eixo de rotação.
Os astrônomos atualmente acreditam que não foi uma única colisão que fez isso com Urano, mas sim uma série de colisões. Se fosse uma só, Urano giraria diferente, com uma série de colisões, elas agem como freios, colocando o planta na rotação correta.
Qual a consequência disso? Bem, imagine você na superfície de Urano (tudo bem, ele não tem superfície é uma bola de gás, mas imagine que tem), se você estivesse no polo você veria o Sol acima do horizonte por 42 anos, fazendo círculos cada vez maiores até desaparecer no horizonte, e depois ficaria 42 anos sem ver o Sol.
O Sistema Solar é feito de sobreviventes, e a nossa Terra, um sobrevivente mais sortudo ainda. Mas olhando para os outros planetas podemos ver que a vida realmente não foi fácil no início da história do Sistema Solar.
(via https://www.youtube.com/watch?v=Nk_hBs2Ci48)
-
 mfreedomstuff reblogged this · 1 month ago
 -
 swan-orpheus liked this · 8 months ago
 -
 delightfulgalaxyphilosopher reblogged this · 1 year ago
 -
delightfulgalaxyphilosopher liked this · 1 year ago
-
 gumincinorbe liked this · 1 year ago
 -
 words-from-rae liked this · 2 years ago
 -
swan-orpheus reblogged this · 2 years ago
-
 luxzzwin liked this · 2 years ago
 -
 anonymoususer1871 reblogged this · 3 years ago
 -
 whispersofbeskar reblogged this · 4 years ago
 -
 howcanididthat-blog liked this · 4 years ago
 -
 spookymoontini liked this · 4 years ago
 -
 herthoughtssssss liked this · 4 years ago
 -
 rodeo-clownn liked this · 4 years ago
 -
 generalpeachalmondalien-blog liked this · 4 years ago
 -
 orpheusmontgomery reblogged this · 4 years ago
 -
orpheusmontgomery liked this · 4 years ago
-
 space-boos liked this · 4 years ago
 -
 nancytangerinepage liked this · 4 years ago
 -
 lilimpfh reblogged this · 4 years ago
 -
lilimpfh liked this · 4 years ago
-
 erinssaurus liked this · 4 years ago
 -
 chupacabruhhhhhhh liked this · 5 years ago
 -
 white-trash-balling reblogged this · 5 years ago
 -
 thegayest-airconditioner liked this · 5 years ago
 -
 taliavaleska liked this · 5 years ago
 -
 monecky liked this · 5 years ago
 -
 biscuitfarmweasel liked this · 5 years ago
 -
 flowsocrazy liked this · 5 years ago
 -
 shaniacsforthewinxx liked this · 5 years ago
 -
 zeitnie liked this · 5 years ago
