Solar System: Things To Know This Week
Solar System: Things to Know This Week

It’s the time of year for summer break, swimming, and oh, yes storms. June 1 marks the beginning of hurricane season on the Atlantic coast, but we’re not alone. Our neighboring planets have seen their fair share of volatile weather, too (like the Cassini spacecraft’s view of the unique six-sided jet stream at Saturn’s north pole known as “the hexagon”).
This week, we present 10 of the solar system’s greatest storms.

1. Jupiter’s Great Red Spot
With tumultuous winds peaking at 400 mph, the Great Red Spot has been swirling wildly over Jupiter’s skies for at least 150 years and possibly much longer. People saw a big spot on Jupiter as early as the 1600s when they started stargazing through telescopes, though it’s unclear whether they were looking at a different storm. Today, scientists know the Great Red Spot has been there for a while, but what causes its swirl of reddish hues remains to be discovered. More >

2. Jupiter’s Little Red Spot
Despite its unofficial name, the Little Red Spot is about as wide as Earth. The storm reached its current size when three smaller spots collided and merged in the year 2000. More >

3. Saturn’s Hexagon
The planet’s rings might get most of the glory, but another shape’s been competing for attention: the hexagon. This jet stream is home to a massive hurricane tightly centered on the north pole, with an eye about 50 times larger than the average hurricane eye on Earth. Numerous small vortices spin clockwise while the hexagon and hurricane spin counterclockwise. The biggest of these vortices, seen near the lower right corner of the hexagon and appearing whitish, spans about 2,200 miles, approximately twice the size of the largest hurricane on Earth. More>
4. Monster Storm on Saturn
A tempest erupted in 2010, extending approximately 9,000 miles north-south large enough to eventually eat its own tail before petering out. The storm raged for 200 days, making it the longest-lasting, planet-encircling storm ever seen on Saturn. More >

5. Mars’ Dust Storm
Better cover your eyes. Dust storms are a frequent guest on the Red Planet, but one dust storm in 2001 larger by far than any seen on Earth raised a cloud of dust that engulfed the entire planet for three months. As the Sun warmed the airborne dust, the upper atmospheric temperature rose by about 80 degrees Fahrenheit. More >

6. Neptune’s Great Dark Spot
Several large, dark spots on Neptune are similar to Jupiter’s hurricane-like storms. The largest spot, named the “Great Dark Spot” by its discoverers, contains a storm big enough for Earth to fit neatly inside. And, it looks to be an anticyclone similar to Jupiter’s Great Red Spot. More >

7. Sun Twister
Not to be confused with Earth’s tornadoes, a stalk-like prominence rose up above the Sun, then split into about four strands that twisted themselves into a knot and dispersed over a two-hour period. This close-up shows the effect is one of airy gracefulness. More >

8. Titan’s Arrow-shaped Storm
The storm blew across the equatorial region of Titan, creating large effects in the form of dark and likely “wet” from liquid hydrocarbons areas on the surface of the moon. The part of the storm visible here measures 750 miles in length east-to-west. The wings of the storm that trail off to the northwest and southwest from the easternmost point of the storm are each 930 miles long. More >

9. Geomagnetic Storms
On March 9, 1989, a huge cloud of solar material exploded from the sun, twisting toward Earth. When this cloud of magnetized solar material called a coronal mass ejection reached our planet, it set off a chain of events in near-Earth space that ultimately knocked out an entire power grid area to the Canadian province Quebec for nine hours. More >
10. Super Typhoon Tip
Back on Earth, Typhoon Tip of 1979 remains the biggest storm to ever hit our planet, making landfall in Japan. The tropical cyclone saw sustained winds peak at 190 mph and the diameter of circulation spanned approximately 1,380 miles. Fortunately, we now have plans to better predict future storms on Earth. NASA recently launched a new fleet of hurricane-tracking satellites, known as the Cyclone Global Navigation Satellite System (CYGNSS), which will use the same GPS technology you and I use in our cars to measure wind speed and ultimately improve how to track and forecast hurricanes. More >
Discover more lists of 10 things to know about our solar system HERE.
Make sure to follow us on Tumblr for your regular dose of space: http://nasa.tumblr.com
More Posts from Nasa and Others
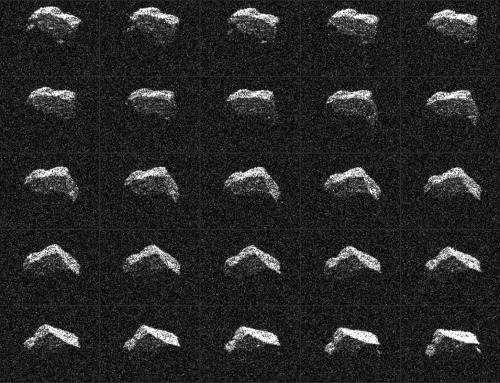
Protecting our Home Planet 🌎

Did you ever wonder how we spots asteroids that may be getting too close to Earth for comfort? Wonder no more. Our Planetary Defense Coordination Office does just that. Thanks to a variety of ground and space based telescopes, we’re able to detect potentially hazardous objects so we can prepare for the unlikely threat against our planet.
What is a near-Earth object?

Near-Earth objects (NEOs) are asteroids and comets that orbit the Sun, but their orbits bring them into Earth’s neighborhood – within 30 million miles of Earth’s orbit.
These objects are relatively unchanged remnant debris from the solar system’s formation some 4.6 billion years ago. Most of the rocky asteroids originally formed in the warmer inner solar system between the orbits of Mars and Jupiter, while comets, composed mostly of water ice with embedded dust particles, formed in the cold outer solar system.
Who searches for near-Earth objects?

Our Near-Earth Object (NEO) Observations Program finds, tracks and monitors near-Earth asteroids and comets. Astronomers supported by the program use telescopes to follow up the discoveries to make additional measurements, as do many observatories all over the world. The Center for Near-Earth Object Studies, based at our Jet Propulsion Laboratory, also uses these data to calculate high-precision orbits for all known near-Earth objects and predict future close approaches by them to Earth, as well as the potential for any future impacts.
How do we calculate the orbit of a near-Earth object?

Scientists determine the orbit of an asteroid by comparing measurements of its position as it moves across the sky to the predictions of a computer model of its orbit around the Sun. The more observations that are used and the longer the period over which those observations are made, the more accurate the calculated orbit and the predictions that can be made from it.
How many near-Earth objects have been discovered so far?
At the start of 2019, the number of discovered NEOs totaled more than 19,000, and it has since surpassed 20,000. An average of 30 new discoveries are added each week. More than 95 percent of these objects were discovered by NASA-funded surveys since 1998, when we initially established its NEO Observations Program and began tracking and cataloguing them.
Currently the risk of an asteroid striking Earth is exceedingly low, but we are constantly monitoring our cosmic neighborhood. Have more questions? Visit our Planetary Defense page to explore how we keep track of near-Earth objects.
Make sure to follow us on Tumblr for your regular dose of space: http://nasa.tumblr.com.
The Universe's Brightest Lights Have Some Dark Origins
Did you know some of the brightest sources of light in the sky come from black holes in the centers of galaxies? It sounds a little contradictory, but it's true! They may not look bright to our eyes, but satellites have spotted oodles of them across the universe.
One of those satellites is our Fermi Gamma-ray Space Telescope. Fermi has found thousands of these kinds of galaxies in the 10 years it's been operating, and there are many more out there!

Black holes are regions of space that have so much gravity that nothing - not light, not particles, nada - can escape. Most galaxies have supermassive black holes at their centers - these are black holes that are hundreds of thousands to billions of times the mass of our sun - but active galactic nuclei (also called "AGN" for short, or just "active galaxies") are surrounded by gas and dust that's constantly falling into the black hole. As the gas and dust fall, they start to spin and form a disk. Because of the friction and other forces at work, the spinning disk starts to heat up.

The disk's heat gets emitted as light - but not just wavelengths of it that we can see with our eyes. We see light from AGN across the entire electromagnetic spectrum, from the more familiar radio and optical waves through to the more exotic X-rays and gamma rays, which we need special telescopes to spot.

About one in 10 AGN beam out jets of energetic particles, which are traveling almost as fast as light. Scientists are studying these jets to try to understand how black holes - which pull everything in with their huge amounts of gravity - somehow provide the energy needed to propel the particles in these jets.

Many of the ways we tell one type of AGN from another depend on how they're oriented from our point of view. With radio galaxies, for example, we see the jets from the side as they're beaming vast amounts of energy into space. Then there's blazars, which are a type of AGN that have a jet that is pointed almost directly at Earth, which makes the AGN particularly bright.

Our Fermi Gamma-ray Space Telescope has been searching the sky for gamma ray sources for 10 years. More than half (57%) of the sources it has found have been blazars. Gamma rays are useful because they can tell us a lot about how particles accelerate and how they interact with their environment.

So why do we care about AGN? We know that some AGN formed early in the history of the universe. With their enormous power, they almost certainly affected how the universe changed over time. By discovering how AGN work, we can understand better how the universe came to be the way it is now.

Fermi's helped us learn a lot about the gamma-ray universe over the last 10 years. Learn more about Fermi and how we're celebrating its accomplishments all year.
Make sure to follow us on Tumblr for your regular dose of space: http://nasa.tumblr.com.
Making the Skies Safe for Unmanned Aircraft
Unmanned Aircraft Systems (commonly known as UAS or drones) are typically a smaller aircraft that fly without an onboard pilot. Currently used for research, testing, and aerial-visual purposes, these vehicles could one day carry cargo, or even passengers, through countryside and city landscapes.

UAS are a key component of our Unmanned Aircraft Systems Integration in the National Aairspace Ssystem (UAS in the NAS) project. Our research will help develop the rules so that unmanned aircraft can safely coexist with manned aircraft in the national airspace.

We collaborate with private companies, like Navmar Applied Science Corporation (NASC), to research and test aerodynamically efficient UAS. We also work with government agencies like the Federal Aviation Administration (FAA) to conduct research that will contribute to setting standards and certifications.

We are leading the nation to open a new era in air transportation called Advanced Air Mobility (AAM). AAM will enable safe, sustainable, affordable, and accessible aviation that moves people and cargo between places using a transformed air transportation system and revolutionary new aircraft.

With new cost-and-fuel efficient aircraft and technologies becoming available, UAS will provide substantial benefit to U.S. industry and the public. Such benefits include air-lifted organ transplant deliveries that arrive more quickly and safely than ever before; and search and rescue missions performed with increased speed and accuracy.

There are other benefits too, like pizza being air- dropped to your front door, and less package delivery trucks on the road. The burgeoning landscape of AAM holds many potentials – and it’s our job to help safely and sustainably map out and navigate what that future landscape looks like.
Want to learn the many ways that NASA is with you when you fly? Visit https://www.nasa.gov/aeronautics. Make sure to follow us on Tumblr for your regular dose of space: http://nasa.tumblr.com.
How Well Do You Know Your Space Photos?
Can you guess the subject of each of these pictures? How many will you get right? Test your friends and family to see who knows their space photos the best.
1. Ice on Earth or a Picture of Mars?

2. Dry Land on Earth or a Close-Up of Jupiter?

3. Mercury or Our Moon?

4. Do You Think This is Mars or Our Home Planet?

5. Waves on Jupiter or Saturn?

6. Is this a picture of Mars or Earth?

7. Can You Tell Which is Europa and Which is the Bottom of a Frying Pan?

8. Close-Up of Our Moon or Dwarf Planet Ceres?

9. A Weird World or Our Own World?

10. The Red Planet or a Red Desert?

Answers
1. Mars. You might be surprised, but this image taken by our Mars Reconnaissance Orbiter is of a light-toned deposit on the Martian surface. Some shapes in the terrain suggest erosion by a fluid moving north to south.
2. Earth. This image taken by our Earth Observing-1 satellite shows Lake Frome in central Australia. In this image, the salt lake appears bone-dry, filled with off-white sediment. This area of Australia receives 149 to 216 millimeters of rainfall a year on average, and the basins pass most of their time as saltpans.
3. Mercury. Our MESSENGER spacecraft captured this image of Mercury during a fly by in October 2008. It shows previously uncharted regions of the planet that have large craters with an internal smoothness similar to Earth’s own moon. It is thought that these craters were to have been flooded by lava flows that are old but not as old as the surrounding more highly cratered surface.
4. Earth. Surprisingly, this image take from the International Space Station shows the western half of the Arabian peninsula in Saudi Arabia. It not only contains large expanses of sand and gravel, but extensive lava fields known as haraat.
5. Saturn. Although this pattern of waves is similar to those seen on Jupiter, this is actually a picture of Saturn. The pattern of an iconic surfer’s wave, has been observed in many places all over the universe, including at the edges of Earth’s magnetic environment.
6. Mars. This image was taken by our Mars Reconnaissance Orbiter and shows dunes of sand-sized materials that have been trapped on the floors of many Martian craters. The dunes are linear, thought to be due to shifting wind directions.
7. Left: Europa. Right: Frying Pan. Europa is one of Jupiter’s moons, and is about the same size as Earth’s moon.
8. Ceres. This image taken by our Dawn spacecraft shows an intriguing mountain on dwarf planet Ceres protruding from a relatively smooth area.
9. Earth. This image of the Bazman volcano is located in a remote region of souther Iran. While the volcano has the classic cone shape of a stratovolcano, it is also heavily dissected by channels that extend downwards from the summit.
10. Earth. This image of the Great Sandy Desert in northwest Australia shows a variety of dune forms across the region. The photo was taken by the Expedition 35 crew from the International Space Station.
Make sure to follow us on Tumblr for your regular dose of space:http://nasa.tumblr.com

Ever want to ask a real life astronaut a question? Here’s your chance!
We are kicking off Hispanic Heritage Month a little early this year, and astronaut Serena M. Auñón-Chancellor will be taking your questions in an Answer Time session on Thursday, September 12 from 12pm - 1pm ET here on NASA’s Tumblr! Find out what it’s like to be a NASA astronaut and learn more about her Cuban-American heritage. Make sure to ask your question now by visiting http://nasa.tumblr.com/ask!
Dr. Serena M. Auñón-Chancellor began working with NASA as a Flight Surgeon in 2006 and was later selected as a NASA astronaut in 2009. Her first flight was from Jun 6- Dec. 20, 2018 where she served as Flight Engineer on the International Space Station as a member of Expeditions 56 and 57. During these missions, the crew contributed to hundreds of experiments in biology, biotechnology, physical science and Earth science – including investigations into a new cancer treatment!
She has a Bachelor of Science in Electrical Engineering from The George Washington University, Washington, D.C and a Doctorate of Medicine from The University of Texas - Health Science Center at Houston.
Dr. Auñón-Chancellor Fun Facts:
She spent 2 months in Antarctica from 2010 to 2011 searching for meteorites as part of the ANSMET expedition.
She served as an Aquanaut on the NEEMO 20 mission in the Aquarius underwater laboratory, which is used to prepare for living and working in space.
She logged 197 days in space during Expeditions 56 and 57.
Follow Serena on Twitter at @AstroSerena and follow NASA on Tumblr for your regular dose of space.
Time for some Sun salutations 🧘
Flow through 133 days of the Sun's activity from Aug. 12 to Dec. 22, 2022, as captured by our Solar Dynamics Observatory. From its orbit around Earth, SDO has steadily imaged the Sun in 4K resolution for nearly 13 years.
Video description: Mellow music plays as compiled images taken every 108 seconds condenses 133 days of solar observations into an hour-long video. The video shows bright active regions passing across the face of the Sun as it rotates.
Credit: NASA's Goddard Space Flight Center, Scott Wiessinger (Lead Producer and editor), Tom Bridgman (Lead Visualizer), Lars Leonhard (music)
Download Software Used to Get Rovers to the Red Planet
Watching our Perseverance rover safely land on the surface of Mars is the kind of historic feat that gets our adventure-loving hearts racing.

Launching and landing rovers on Mars requires overcoming challenges like defying gravity on two planets, surviving the extreme heat of atmospheric entry, and avoiding rocky obstacles. This takes more than just rocket science – it takes incredible software too.
Did you know that some of the same tried and tested software that helped ensure a safe arrival for Perseverance (and its predecessor, Curiosity) can be downloaded – by you...for free...right now?

Our 2021-22 Software Catalog is full of codes made for space that can be used by entrepreneurs, teachers, gamers, or just about anyone. Whether you are curious about the Martian atmosphere, want to visualize the inside of a volcano, or have an application we’ve never even considered, our software may be able to help. Check out our full site, updated regularly with the latest codes available for download.
Here are a few examples of what you could do with our software!
1. Simulate the Martian atmosphere to prepare spacecrafts for landing

To prepare for exactly what a spacecraft will face on landing day, no matter the location scientists choose, we created software that simulates the Martian atmosphere. The code, Mars (GRAM), is now available to anyone.
We also have a version that simulates Earth's atmosphere, allowing users (especially those in the world of drone design) a way to replicate and design for, potentially dangerous conditions without ever stepping away from the computer.
2. Explore the Red Planet virtually from home with help from the Curiosity rover team
Originally developed for scientists and engineers working on the Curiosity rover mission, OnSight allowed the team a virtual way to walk on and look around Mars. Using an immersive display, such as a virtual reality headset, scientists could see the Red Planet the way a rover would.
This software can also be used to provide virtual experiences of places here on Earth, such as caves and lava fields.
3. Dodge disasters with a risk management tool made for space missions

When preparing for complex space missions, like the upcoming Mars Sample Return mission, it’s crucial to examine how different elements, independently and collectively, impact the probability of success.
But risk management has become an important tool for businesses of all disciplines, from engineering to accounting – and the Space Mission Architecture and Risk Analysis Tool (SMART) could help.
Sound interesting? The NASA software catalog has these and more than 800 additional codes ready for download.
You can also follow our Technology Transfer program on Twitter to learn more about software and technology that can be put to use on Earth.
Make sure to follow us on Tumblr for your regular dose of space!
How Climate Change Showed Up in 2021
2021 was tied for the sixth-hottest year since modern record keeping began. We work together with the National Oceanic and Atmospheric Administration to track temperatures around the world and study how they change from year to year.

For decades, the overall global temperature has been increasing because of human activities. The last decade has been the warmest on record. Each individual year’s average temperature, however, can be affected by things like ocean circulation, volcanic eruptions, and specific weather events.
For instance, last year we saw the beginning of La Niña – a pattern of cooler waters in the Pacific – that was responsible for slightly cooling 2021’s average temperature. Still, last year continued a long-term trend of global warming.
Globally, Earth’s temperature in 2021 was nearly 2°F warmer than the late 19th Century, for the seventh year in a row.

The Record
Studying 142 Years
Since 1880, we can put together a consistent record of temperatures around the planet and see that it was much colder in the late-19th century. Before 1880, uncertainties in tracking global temperatures are larger. Temperatures have increased even faster since the 1970s, the result of increasing greenhouse gases in the atmosphere.
Tracking Millions of Individual Observations
Our scientists use millions of individual observations of data from more than 20,000 weather stations and Antarctic research stations, together with ship- and buoy-based observations of sea surface temperatures, to track global temperatures.

Reviewing Multiple Independent Records
Our global temperature record – GISTEMP – is one of a number of independent global temperature records, all of which show the same pattern of warming.

The Consequences
Everywhere Experiences Climate Change Differently
As Earth warms, temperature changes occur unevenly around the globe. The Arctic is currently warming about four times faster than the rest of the planet – a process called Arctic amplification. Similarly, urban areas tend to warm faster than rural areas, partly because building materials like asphalt, steel and concrete retain heat.

Droughts and Floods in Warmer Weather
More than 88% of the Western US experienced drought conditions in 2021. At the same time, communities in Western Europe saw two months’ worth of rain in 24 hours, breaking records and triggering flash floods. Because a hotter climate means more water can be carried in the atmosphere, areas like the Western US suffer drought from the increased 'thirstiness' of the atmosphere, while precipitation events can become more extreme as the amount of moisture in the atmosphere rises.

Sea Levels Continue to Rise
Melting ice raises sea levels around the world, as meltwater drains into the ocean. In addition, heat causes the ocean water to expand. From 1993 to today, global mean sea level has been rising around 3.4 millimeters per year. In 2021, sea level data from the recently launched NASA/ESA Sentinel-6 Michael Freilich mission became available to the public.

There is Hope
“This is not good news, but the fact that we are able to track this in real time and understand why it’s changing, and get people to notice why it’s changing and how we can change things to change the next trajectory, that gives me hope. Because we’re not in the dark here. We’re not the dinosaurs who are unaware the comet is coming. We can see the comet coming, and we can act.” – Dr. Gavin Schmidt, director of NASA GISS, where the global temperature record is calculated
Make sure to follow us on Tumblr for your regular dose of space!
Beached Berg in Alaska
Each year since 2009, geophysicist and pilot Chris Larsen has led two sets of flights to monitor Alaska’s mountain glaciers. From the air, scientists like Larsen collect critical information on how the region’s snow and ice is changing. They also are in a good position to snap photographs of the stunning landscape. Larsen was flying with NASA science writer Maria-Jose Viñas on board. During a flight on August 19, 2018, Viñas shot this photograph during a mission to survey Yakutat Icefield and nearby glaciers in southeast Alaska.

The beach and stream in the photograph are in Russel Fjord near the terminus of the Hubbard Glacier. While this photograph does not show any glaciers, evidence of their presence is all around. Meltwater winds down a vegetation-free path of glacial till. On its way toward open water, the stream cuts through a beach strewn with icebergs. “The Hubbard Glacier has a broad and active calving front providing a generous supply of icebergs,” said Larsen, a researcher at the University of Alaska, Fairbanks. “They are present all summer since new ones keep coming from the glacier.”
NASA’s Operation IceBridge makes lengthy flights each year over the landmasses of Greenland and Antarctica and their surrounding sea ice. While IceBridge-Alaska flights are shorter in length, the terrain is equally majestic and its snow and ice important to monitor. Wherever IceBridge flights are made, data collection depends in part on weather and instruments.
Read more: https://go.nasa.gov/2Mj48r0
Make sure to follow us on Tumblr for your regular dose of space: http://nasa.tumblr.com.
From Microscopic to Multicellular: Six Stories of Life that We See from Space
Life. It's the one thing that, so far, makes Earth unique among the thousands of other planets we've discovered. Since the fall of 1997, NASA satellites have continuously and globally observed all plant life at the surface of the land and ocean. During the week of Nov. 13-17, we are sharing stories and videos about how this view of life from space is furthering knowledge of our home planet and the search for life on other worlds.

Earth is the only planet with life, as far as we know. From bacteria in the crevices of the deepest oceans to monkeys swinging between trees, Earth hosts life in all different sizes, shapes and colors. Scientists often study Earth from the ground, but some also look to our satellites to understand how life waxes and wanes on our planet.
Over the years, scientists have used this aerial view to study changes in animal habitats, track disease outbreaks, monitor forests and even help discover a new species. While this list is far from comprehensive, these visual stories of bacteria, plants, land animals, sea creatures and birds show what a view from space can reveal.
1. Monitoring the single-celled powerhouses of the sea

Known as the grass of the ocean, phytoplankton are one of the most abundant types of life in the ocean. Usually single-celled, these plant-like organisms are the base of the marine food chain. They are also responsible for the only long-term transfer of carbon dioxide from Earth’s atmosphere to the ocean.
Even small changes in phytoplankton populations can affect carbon dioxide concentrations in the atmosphere, which could ultimately affect Earth’s global surface temperatures. Scientists have been observing global phytoplankton populations continuously since 1997 starting with the Sea-Viewing Wide Field-of View Sensor (SeaWiFS). They continue to study the small life-forms by satellite, ships and aircrafts.
2. Predicting cholera bacteria outbreaks
Found on the surface of zooplankton and in contaminated water, the bacteria that cause the infectious disease cholera — Vibrio cholerae — affect millions of people every year with severe diarrhea, sometimes leading to death. While our satellite sensors can’t detect the actual bacteria, scientists use various satellite data to look for the environmental conditions that the bacteria thrive in.
Specifically, microbiologist Rita Colwell at the University of Maryland, College Park, and West Virginia University hydrologist Antar Jutla studied data showing air and ocean temperature, salinity, precipitation, and chlorophyllconcentrations, the latter a marker for zooplankton. Anticipating where the bacteria will bloom helps researchers to mitigate outbreaks.

Recently, Colwell and Jutla have been able to estimate cholera risk after major events, such as severe storms, by looking at satellite precipitation data, air temperature, and population maps. The two maps above show the team's predicted cholera risk in Haiti two weeks after Hurricane Matthew hit over October 1-2, 2016 and the actual reported cholera cases in October 2016.
3. Viewing life on land
From helping preserve forests for chimpanzees to predicting deer population patterns, scientists use our satellites to study wildlife across the world. Satellites can also see the impacts of perhaps the most relatable animal to us: humans. Every day, we impact our planet in many ways including driving cars, constructing buildings and farming – all of which we can see with satellites.

Our Black Marble image provides a unique view of human activity. Looking at trends in our lights at night, scientists can study how cities develop over time, how lighting and activity changes during certain seasons and holidays, and even aid emergency responders during power outages caused by natural disasters.
4. Tracking bird populations
Scientists use our satellite data to study birds in a variety of ways, from understanding their migratory patterns, to spotting potential nests, to tracking populations. In a rather creative application, scientists used satellite imagery to track Antarctica’s emperor penguin populations by looking for their guano – or excrement.

Counting emperor penguins from the ground perspective is challenging because they breed in some of the most remote and cold places in the world, and in colonies too large to easily count manually. With their black and white coats, emperor penguins are also difficult to count from an aerial view as they sometimes blend in with shadows on the ice. Instead, Phil Trathan and his colleagues at the British Antarctic Survey looked through Landsat imagery for brown stains on the sea ice. By looking for penguin droppings, Trathan said his team identified 54 emperor penguin colonies along the Antarctic coast.
5. Parsing out plant life
Just as we see plants grow and wilt on the ground, satellites observe the changes from space. Flourishing vegetation can indicate a lively ecosystem while changes in greenery can sometimes reveal natural disasters, droughts or even agricultural practices. While satellites can observe plant life in our backyards, scientists can also use them to provide a global picture.

Using data from satellites including SeaWiFS, and instruments including the NASA/NOAA Visible Infrared Imaging Radiometer Suite and the Moderate Resolution Imaging Spectroradiometer, scientists have the most complete view of global biology to date, covering all of the plant life on land and at the surface of the ocean.
6. Studying life under the sea
Our satellites have helped scientists study creatures living in the oceans whether it’s finding suitable waters for oysters or protecting the endangered blue whale. Scientists also use the data to learn more about one of the most vulnerable ecosystems on the planet – coral reefs.

They may look like rocks or plants on the seafloor, but corals are very much living animals. Receiving sustenance from photosynthetic plankton living within their calcium carbonate structures, coral reefs provide food and shelter for many kinds of marine life, protect shorelines from storms and waves, serve as a source for potential medicines, and operate as some of the most diverse ecosystems on the planet.

However, coral reefs are vulnerable to the warming of the ocean and human activity. Our satellites measure the surface temperature of ocean waters. These measurements have revealed rising water temperatures surrounding coral reef systems around the world, which causes a phenomenon known as “coral bleaching.” To add to the satellite data, scientists use measurements gathered by scuba divers as well as instruments flown on planes.
During the week of Nov. 13-17, check out our stories and videos about how this view of life from space is furthering knowledge of our home planet and the search for life on other worlds. Follow at www.nasa.gov/Earth.
Make sure to follow us on Tumblr for your regular dose of space: http://nasa.tumblr.com.
-
 trouvailleeeee liked this · 4 years ago
 -
 kaliforniakruisin liked this · 4 years ago
 -
 warrenbritt reblogged this · 4 years ago
 -
warrenbritt liked this · 4 years ago
-
 apolloanecdotes liked this · 4 years ago
 -
 zyasli liked this · 5 years ago
 -
 kentama1193 liked this · 5 years ago
 -
 antedeus liked this · 5 years ago
 -
 lovablehoseok reblogged this · 5 years ago
 -
 backupaccount107 reblogged this · 6 years ago
 -
 zenfroggi7 liked this · 6 years ago
 -
 90selderichhorror liked this · 6 years ago
 -
 210z liked this · 6 years ago
 -
 boredgdesigner liked this · 6 years ago
 -
 beaulamaie liked this · 6 years ago
 -
factfvckswithfiction liked this · 6 years ago
-
 getalonereallywell liked this · 6 years ago
 -
 yessssssssssssssss liked this · 7 years ago
 -
 shadowman-99 liked this · 7 years ago
 -
 fammivolareancora-blog liked this · 7 years ago
 -
 cthonisprincess liked this · 7 years ago
 -
 vintagevickyy liked this · 7 years ago
 -
 irenefowlkes liked this · 7 years ago
 -
 tunnelsystem liked this · 7 years ago
 -
sleepygriffon2014 liked this · 7 years ago
-
 trippyskippy liked this · 7 years ago
 -
 adamthegirl reblogged this · 7 years ago
 -
 berbsblog liked this · 7 years ago
 -
 weirdtalesanduniverse-blog reblogged this · 7 years ago
 -
adamthegirl liked this · 7 years ago
-
 witchofthewine reblogged this · 7 years ago
 -
 sleepy-dragons liked this · 7 years ago
 -
 englishbunnyrocks liked this · 7 years ago
Explore the universe and discover our home planet with the official NASA Tumblr account
1K posts