Curate, connect, and discover
Planet - Blog Posts
10 Ways to BBQ on an Alien World
There are over 3,700 planets in our galaxy. Many of them orbit stars outside our solar system, these are known as exoplanets. Spend a summer weekend barbecuing it up on any of these alien worlds.
(WARNING: Don't try any of this on Earth—except the last one.)
1. Lava World
Janssen aka 55 Cancri e

Hang your steak on a fishing pole and dangle your meat over the boiling pools of lava on this possible magma world. Try two to three minutes on each side to get an ashy feast of deliciousness.
2. Hot Jupiter
Dimidium aka 51 Pegasi b

Set your grill to 1800 degrees Fahrenheit (982 degrees Celsius) or hop onto the first exoplanet discovered and get a perfect char on your hot dogs. By the time your dogs are done, it’ll be New Year’s Eve, because a year on this planet is only four days long.
3. Super Earth
HD 40307 g

Super air fry your duck on this Super Earth, as you skydive in the intense gravity of a planet twice as massive as Earth. Why are you air frying a duck? We don’t know. Why are you skydiving on an exoplanet? We’re not judging.
4. Lightning Neptune
HAT-P-11b

I’ve got steaks, they’re multiplying/and I’m looooosing control. Cause the power this planet is supplying/is electrifying!
Sear your tuna to perfection in the lightning strikes that could flash across the stormy skies of this Neptune-like planet named HAT-P-11b.
5. Red Earth
Kepler-186f

Tired of all that meat? Try a multi-colored salad with the vibrant plants that could grow under the red sun of this Earth-sized planet. But it could also be a lifeless rock, so BYOB (bring your own barbecue).
6. Inferno World
Kepler-70b

Don’t take too long to prep your vegetables for the grill! The hottest planet on record will flash-incinerate your veggies in seconds!
7. Egg-shaped
WASP-12b

Picture this: You are pressure cooking your chicken on a hot gas giant in the shape of an egg. And you’re under pressure to cook fast, because this gas giant is being pulled apart by its nearby star.
8. Two suns
Kepler-16b

Evenly cook your ribs in a dual convection oven under the dual stars of this “Tatooine.” Kick back and watch your two shadows grow in the fading light of a double sunset.
9. Takeout
Venus

Order in for a staycation in our own solar system. The smell of rotten eggs rising from the clouds of sulfuric acid and choking carbon dioxide will put you off cooking, so get that meal to go.
10. Take a Breath
Earth

Sometimes the best vacations are the ones you take at home. Flip your burgers on the only planet where you can breathe the atmosphere.
Grill us on Twitter and tell us how bad our jokes are.
Read the full version of this week’s ‘Solar System: 10 Things to Know’ Article HERE.
Make sure to follow us on Tumblr for your regular dose of space: http://nasa.tumblr.com.
Hunting for Organic Molecules on Mars

Did Mars once have life? To help answer that question, an international team of scientists created an incredibly powerful miniature chemistry laboratory, set to ride on the next Mars rover.

The instrument, called the Mars Organic Molecule Analyzer Mass Spectrometer (MOMA-MS), will form a key part of the ExoMars Rover, a joint mission between the European Space Agency (ESA) and Roscosmos. A mass spectrometer is crucial to send to Mars because it reveals the elements that can be found there. A Martian mass spectrometer takes a sample, typically of powdered rock, and distinguishes the different elements in the sample based on their mass.

After 8 years of designing, building, and testing, NASA scientists and engineers from NASA’s Goddard Space Flight Center said goodbye to their tiny chemistry lab and shipped it to Italy in a big pink box. Building a tiny instrument capable of conducting chemical analysis is difficult in any setting, but designing one that has to launch on a huge rocket, fly through the vacuum of space, and then operate on a planet with entirely different pressure and temperature systems? That’s herculean. And once on Mars, MOMA has a very important job to do. NASA Goddard Center Director Chris Scolese said, “This is the first intended life-detecting instrument that we have sent to Mars since Viking.”

The MOMA instrument will be capable of detecting a wide variety of organic molecules. Organic compounds are commonly associated with life, although they can be created by non-biological processes as well. Organic molecules contain carbon and hydrogen, and can include oxygen, nitrogen, and other elements.

To find these molecules on Mars, the MOMA team had to take instruments that would normally occupy a couple of workbenches in a chemistry lab and shrink them down to roughly the size of a toaster oven so they would be practical to install on a rover.

MOMA-MS, the mass spectrometer on the ExoMars rover, will build on the accomplishments from the Sample Analysis at Mars (SAM), an instrument suite on the Curiosity rover that includes a mass spectrometer. SAM collects and analyzes samples from just below the surface of Mars while ExoMars will be the first to explore deep beneath the surface, with a drill capable of taking samples from as deep as two meters (over six feet). This is important because Mars’s thin atmosphere and spotty magnetic field offer little protection from space radiation, which can gradually destroy organic molecules exposed on the surface. However, Martian sediment is an effective shield, and the team expects to find greater abundances of organic molecules in samples from beneath the surface.

On completion of the instrument, MOMA Project Scientist Will Brinckerhoff praised his colleagues, telling them, “You have had the right balance of skepticism, optimism, and ambition. Seeing this come together has made me want to do my best.”
In addition to the launch of the ESA and Roscosmos ExoMars Rover, in 2020, NASA plans to launch the Mars 2020 Rover, to search for signs of past microbial life. We are all looking forward to seeing what these two missions will find when they arrive on our neighboring planet.
Learn more about MOMA HERE.
Learn more about ExoMars HERE.
Follow @NASASolarSystem on Twitter for more about our missions to other planets.
Make sure to follow us on Tumblr for your regular dose of space: http://nasa.tumblr.com.
Celebrating the Earth (Off the Earth!)
To find the perfect perch for Earth observation research, just look up – about 240 miles up. The International Space Station serves as an optimal platform for studying our dynamic planet, where spectacular views support science.

With currently active instruments and facilities like High Definition Earth Viewing, Crew Earth Observations, Lightning Imaging Sensor, SAGE-III and Meteor, researchers on the ground are able to use the station’s unique (and useful!) vantage point to track Earth’s weather patterns, obtain images documenting changes on the planet’s surface, understand the origin of meteors falling towards Earth, and better understand the atmosphere.
The space station’s 90-minute orbit allows it to cover 90% of the Earth’s populated surfaces. That means we are able to study A LOT of that big blue marble.
Let’s talk a little about how the space station serves as a platform for Earth observation:

Each day, as the space station passes over regions of the Earth, crew members photograph the area below as a part of the Crew Earth Observations Facility investigation, one of the longest-running experiments on the orbiting laboratory. Crew members are able to photograph large-scale weather events like the recent Hurricane Harvey from the space station’s Cupola. These little science postcards from space can be used by researchers and the public to learn more about our home planet.
Want to see a picture of your hometown from space? Search for it in the Gateway to Astronaut Photography of Earth (GAPE).

The High Definition Earth Viewing (HDEV) experiment streams live video of Earth for online viewing. This investigation not only provides hours and hours of footage of the Earth below, but also demonstrates how the technology holds up against the harsh environment of space. High school students helped design some of the cameras' components, through the High Schools United with NASA to Create Hardware (HUNCH) program, and student teams perform most of the HDEV operation. (Whoa! Check out HUNCH and STEM on Station for more opportunities for student involvement!)
Useful for weather forecasting, hurricane monitoring, and observations of large-scale climate phenomena such as El Niño, RapidScat used radar pulses reflected off the ocean to measure wind speed and direction over the ocean.

RapidScat completed its successful two-year mission, outlasting its original decommission date before suffering a power loss. Although RapidScat is no longer transmitting data back to Earth, the station hosts many other Earth-observation tools the Cyclone Intensity Measurements from the ISS (CyMISS) an experiment that seeks to develop detailed information on tropical storm structure to better estimate storm intensity, which will help government agencies to better prepare communities for impending natural disasters; and the Cloud-Aerosol Transport System (CATS), a previously-flown lidar instrument which measured atmospheric profiles of aerosols and clouds to better understand their properties and interactions, as well as provided data useful to improving climate change models.

Learn more about RapidScat’s mission conclusion HERE! Take a look at CATS mission data HERE!
Watch more inspiring videos and learn about how we’re capturing the beauty of Earth HERE.

Crew members are able to photograph large-scale weather events like the recent Hurricane Harvey from the space station’s Cupola. These little science postcards from space can be used by researchers and the public to learn more about our home planet.
Plants in space!
Future long-duration missions into the solar system will require a fresh food supply to supplement crew diets, which means growing crops in space. Growing food in such a harsh environment also teaches us a little bit about growing in harsh environments here on Earth.
Here are a few plant-based investigations currently happening aboard the orbiting laboratory:

Veggie is a chamber on the space station that helps scientists grow, harvest and study different space crops. This experiment is called VEG-03D and they’ve been able to grow six rounds of crops so far.
SpaceX's 13th Commercial Resupply vehicle carried many valuable items to the orbiting laboratory, including Plant Gravity Perception, an investigation that uses the European Modular Cultivation System (EMCS) to simulate gravity to help plants grow its roots downward, and shoots upwards. The shoots need to face upwards, towards the light, so they can absorb sunlight and nutrients. Without this, plants wouldn’t know which way to grow. Yikes!
Learn more about Plant Gravity Perception HERE!

The Advanced Plant Habitat is a large chamber that supports commercial and fundamental plant research for at least one year of continuous use. A great feature to this habitat is that the astronauts can view the plant’s progress through a window on the door.
Whether astronauts are taking pictures of the planet or growing crops in space, all science aboard the space station plants seeds for a better life on Earth. Biology investigations directly grow our knowledge of agricultural techniques for harsh environments and imagery from space can give us a clearer idea of our planet’s health and emerging weather patterns.

Make sure to follow us on Tumblr for your regular dose of space: http://nasa.tumblr.com.
10 Things: Journey to the Center of Mars
May the fifth be with you because history is about to be made: As early as May 5, 2018, we’re set to launch Mars InSight, the very first mission to study the deep interior of Mars. We’ve been roaming the surface of Mars for a while now, but when InSight lands on Nov. 26, 2018, we’re going in for a deeper look. Below, 10 things to know as we head to the heart of Mars.

Coverage of prelaunch and launch activities begins Thursday, May 3, on NASA Television and our homepage.
1. What’s in a name?

"Insight" is to see the inner nature of something, and the InSight lander—a.k.a. Interior Exploration using Seismic Investigations, Geodesy and Heat Transport—will do just that. InSight will take the "vital signs" of Mars: its pulse (seismology), temperature (heat flow) and reflexes (radio science). It will be the first thorough check-up since the planet formed 4.5 billion years ago.
2. Marsquakes.
You read that right: earthquakes, except on Mars. Scientists have seen a lot of evidence suggesting Mars has quakes, and InSight will try to detect marsquakes for the first time. By studying how seismic waves pass through the different layers of the planet (the crust, mantle and core), scientists can deduce the depths of these layers and what they're made of. In this way, seismology is like taking an X-ray of the interior of Mars.
Want to know more? Check out this one-minute video.
3. More than Mars.

InSight is a Mars mission, but it’s also so much more than that. By studying the deep interior of Mars, we hope to learn how other rocky planets form. Earth and Mars were molded from the same primordial stuff more than 4.5 billion years ago, but then became quite different. Why didn’t they share the same fate? When it comes to rocky planets, we’ve only studied one in great detail: Earth. By comparing Earth's interior to that of Mars, InSight's team hopes to better understand our solar system. What they learn might even aid the search for Earth-like planets outside our solar system, narrowing down which ones might be able to support life.
4. Robot testing.
InSight looks a bit like an oversized crane game: When it lands on Mars this November, its robotic arm will be used to grasp and move objects on another planet for the first time. And like any crane game, practice makes it easier to capture the prize.
Want to see what a Mars robot test lab is like? Take a 360 tour.
5. The gang’s all here.

InSight will be traveling with a number of instruments, from cameras and antennas to the heat flow probe. Get up close and personal with each one in our instrument profiles.
6. Trifecta.

InSight has three major parts that make up the spacecraft: Cruise Stage; Entry, Descent, and Landing System; and the Lander. Find out what each one does here.
7. Solar wings.
Mars has weak sunlight because of its long distance from the Sun and a dusty, thin atmosphere. So InSight’s fan-like solar panels were specially designed to power InSight in this environment for at least one Martian year, or two Earth years.
8. Clues in the crust.

Our scientists have found evidence that Mars’ crust is not as dense as previously thought, a clue that could help researchers better understand the Red Planet’s interior structure and evolution. “The crust is the end-result of everything that happened during a planet’s history, so a lower density could have important implications about Mars’ formation and evolution,” said Sander Goossens of our Goddard Space Flight Center in Greenbelt, Maryland.
9. Passengers.

InSight won’t be flying solo—it will have two microchips on board inscribed with more than 2.4 million names submitted by the public. "It's a fun way for the public to feel personally invested in the mission," said Bruce Banerdt of our Jet Propulsion Laboratory, the mission's principal investigator. "We're happy to have them along for the ride."
10. Tiny CubeSats, huge firsts.

The rocket that will loft InSight beyond Earth will also launch a separate NASA technology experiment: two mini-spacecraft called Mars Cube One, or MarCO. These suitcase-sized CubeSats will fly on their own path to Mars behindInSight. Their goal is to test new miniaturized deep space communication equipment and, if the MarCOs make it to Mars, may relay back InSight data as it enters the Martian atmosphere and lands. This will be a first test of miniaturized CubeSat technology at another planet, which researchers hope can offer new capabilities to future missions.
Check out the full version of ‘Solar System: 10 Thing to Know This Week’ HERE.
Make sure to follow us on Tumblr for your regular dose of space: http://nasa.tumblr.com.
Earth: Your Home, Our Mission
We pioneer and support an amazing range of advanced technologies and tools to help us better understand our home planet, the solar system and far beyond.
Here are 5 ways our tech improves life here on Earth...
1. Eyes in the Sky Spot Fires on the Ground

Our Earth observing satellites enable conservation groups to spot and monitor fires across vast rainforests, helping them protect our planet on Earth Day and every day.
2. Helping Tractors Drive Themselves

There has been a lot of talk about self-driving cars, but farmers have already been making good use of self-driving tractors for more than a decade - due in part to a partnership between John Deere and our Jet Propulsion Laboratory.
Growing food sustainably requires smart technology - our GPS correction algorithms help self-driving tractors steer with precision, cutting down on water and fertilizer waste.
3. Turning Smartphones into Satellites

On Earth Day (and every day), we get nonstop "Earth selfies" thanks to Planet Labs' small satellites, inspired by smartphones and created by a team at our Ames Research Center. The high res imagery helps conservation efforts worldwide.
4. Early Flood Warnings

Monsoons, perhaps the least understood and most erratic weather pattern in the United States, bring rain vital to agriculture and ecosystems, but also threaten lives and property. Severe flash-flooding is common. Roads are washed out. Miles away from the cloudburst, dry gulches become raging torrents in seconds. The storms are often accompanied by driving winds, hail and barrages of lightning.
We are working to get better forecasting information to the National Oceanic and Atmospheric Administration (NOAA). Our satellites can track moisture in the air - helping forecasters provide an early warning of flash floods from monsoons.
5. Watching the World's Water

Around the world, agriculture is by far the biggest user of freshwater. Thanks in part to infrared imagery from Landsat, operated by the U.S. Geological Survey (USGS), we can now map, in real time, how much water a field is using, helping conserve that precious resource.
We use the vantage point of space to understand and explore our home planet, improve lives and safeguard our future. Our observations of Earth’s complex natural environment are critical to understanding how our planet’s natural resources and climate are changing now and could change in the future.
Join the celebration online by using #NASA4Earth.
Make sure to follow us on Tumblr for your regular dose of space: http://nasa.tumblr.com.
Earth from Afar
“It suddenly struck me that that tiny pea, pretty and blue, was the Earth. I put up my thumb and shut one eye, and my thumb blotted out the planet Earth. I didn't feel like a giant. I felt very, very small.” - Neil Armstrong, Apollo 11

This week we're celebrating Earth Day 2018 with some of our favorite images of Earth from afar...
At 7.2 million Miles...and 4 Billion Miles

Voyager famously captured two unique views of our homeworld from afar. One image, taken in 1977 from a distance of 7.3 million miles (11.7 million kilometers) (above), showed the full Earth and full Moon in a single frame for the first time in history. The second (below), taken in 1990 as part of a “family portrait of our solar system from 4 billion miles (6.4 billion kilometers), shows Earth as a tiny blue speck in a ray of sunlight.” This is the famous “Pale Blue Dot” image immortalized by Carl Sagan.

“This was our willingness to see the Earth as a one-pixel object in a far greater cosmos,” Sagan’s widow, Ann Druyan said of the image. “It's that humility that science gives us. That weans us from our childhood need to be the center of things. And Voyager gave us that image of the Earth that is so heart tugging because you can't look at that image and not think of how fragile, how fragile our world is. How much we have in common with everyone with whom we share it; our relationship, our relatedness, to everyone on this tiny pixel."
A Bright Flashlight in a Dark Sea of Stars

Our Kepler mission captured Earth’s image as it slipped past at a distance of 94 million miles (151 million kilometers). The reflection was so extraordinarily bright that it created a saber-like saturation bleed across the instrument’s sensors, obscuring the neighboring Moon.
Hello and Goodbye

This beautiful shot of Earth as a dot beneath Saturn’s rings was taken in 2013 as thousands of humans on Earth waved at the exact moment the spacecraft pointed its cameras at our home world. Then, in 2017, Cassini caught this final view of Earth between Saturn’s rings as the spacecraft spiraled in for its Grand Finale at Saturn.
‘Simply Stunning’

"The image is simply stunning. The image of the Earth evokes the famous 'Blue Marble' image taken by astronaut Harrison Schmitt during Apollo 17...which also showed Africa prominently in the picture." -Noah Petro, Deputy Project Scientist for our Lunar Reconnaissance Orbiter mission.
Goodbye—for now—at 19,000 mph

As part of an engineering test, our OSIRIS-REx spacecraft captured this image of Earth and the Moon in January 2018 from a distance of 39.5 million miles (63.6 million kilometers). When the camera acquired the image, the spacecraft was moving away from our home planet at a speed of 19,000 miles per hour (8.5 kilometers per second). Earth is the largest, brightest spot in the center of the image, with the smaller, dimmer Moon appearing to the right. Several constellations are also visible in the surrounding space.
The View from Mars

A human observer with normal vision, standing on Mars, could easily see Earth and the Moon as two distinct, bright "evening stars."
Moon Photobomb

"This image from the Deep Space Climate Observatory (DSCOVR) satellite captured a unique view of the Moon as it moved in front of the sunlit side of Earth in 2015. It provides a view of the far side of the Moon, which is never directly visible to us here on Earth. “I found this perspective profoundly moving and only through our satellite views could this have been shared.” - Michael Freilich, Director of our Earth Science Division.
Eight Days Out

Eight days after its final encounter with Earth—the second of two gravitational assists from Earth that helped boost the spacecraft to Jupiter—the Galileo spacecraft looked back and captured this remarkable view of our planet and its Moon. The image was taken from a distance of about 3.9 million miles (6.2 million kilometers).
A Slice of Life

Earth from about 393,000 miles (633,000 kilometers) away, as seen by the European Space Agency’s comet-bound Rosetta spacecraft during its third and final swingby of our home planet in 2009.
So Long Earth

The Mercury-bound MESSENGER spacecraft captured several stunning images of Earth during a gravity assist swingby of our home planet on Aug. 2, 2005.
Earth Science: Taking a Closer Look

Our home planet is a beautiful, dynamic place. Our view from Earth orbit sees a planet at change. Check out more images of our beautiful Earth here.
Join Our Earth Day Celebration!
We pioneer and supports an amazing range of advanced technologies and tools to help scientists and environmental specialists better understand and protect our home planet - from space lasers to virtual reality, small satellites and smartphone apps.
To celebrate Earth Day 2018, April 22, we are highlighting many of these innovative technologies and the amazing applications behind them.
Learn more about our Earth Day plans HERE.
Make sure to follow us on Tumblr for your regular dose of space: http://nasa.tumblr.com
The Hunt for New Worlds Continues with TESS
We're getting ready to start our next mission to find new worlds! The Transiting Exoplanet Survey Satellite (TESS) will find thousands of planets beyond our solar system for us to study in more detail. It's preparing to launch from our Kennedy Space Center at Cape Canaveral in Florida.

Once it launches, TESS will look for new planets that orbit bright stars relatively close to Earth. We're expecting to find giant planets, like Jupiter, but we're also predicting we'll find Earth-sized planets. Most of those planets will be within 300 light-years of Earth, which will make follow-up studies easier for other observatories.

TESS will find these new exoplanets by looking for their transits. A transit is a temporary dip in a star's brightness that happens with predictable timing when a planet crosses between us and the star. The information we get from transits can tell us about the size of the planet relative to the size of its star. We've found nearly 3,000 planets using the transit method, many with our Kepler space telescope. That's over 75% of all the exoplanets we've found so far!

TESS will look at nearly the entire sky (about 85%) over two years. The mission divides the sky into 26 sectors. TESS will look at 13 of them in the southern sky during its first year before scanning the northern sky the year after.

What makes TESS different from the other planet-hunting missions that have come before it? The Kepler mission (yellow) looked continually at one small patch of sky, spotting dim stars and their planets that are between 300 and 3,000 light-years away. TESS (blue) will look at almost the whole sky in sections, finding bright stars and their planets that are between 30 and 300 light-years away.

TESS will also have a brand new kind of orbit (visualized below). Once it reaches its final trajectory, TESS will finish one pass around Earth every 13.7 days (blue), which is half the time it takes for the Moon (gray) to orbit. This position maximizes the amount of time TESS can stare at each sector, and the satellite will transmit its data back to us each time its orbit takes it closest to Earth (orange).

Kepler's goal was to figure out how common Earth-size planets might be. TESS's mission is to find exoplanets around bright, nearby stars so future missions, like our James Webb Space Telescope, and ground-based observatories can learn what they're made of and potentially even study their atmospheres. TESS will provide a catalog of thousands of new subjects for us to learn about and explore.

The TESS mission is led by MIT and came together with the help of many different partners. Learn more about TESS and how it will further our knowledge of exoplanets, or check out some more awesome images and videos of the spacecraft. And stay tuned for more exciting TESS news as the spacecraft launches!
Watch the Launch!
*April 16 Update*
Launch teams are standing down today to conduct additional Guidance Navigation and Control analysis, and teams are now working towards a targeted launch of the Transiting Exoplanet Survey Satellite (TESS) on Wednesday, April 18. The TESS spacecraft is in excellent health, and remains ready for launch. TESS will launch on a Falcon 9 rocket from Space Launch Complex 40 at Cape Canaveral Air Force Station in Florida.
For more information and updates, visit: https://blogs.nasa.gov/tess/
Live Launch Coverage!
TESS is now slated to launch on Wednesday, April 18 on a SpaceX Falcon 9 rocket from our Kennedy Space Center in Florida.
Watch HERE.
Make sure to follow us on Tumblr for your regular dose of space: http://nasa.tumblr.com
Solar System: 10 Things to Know
All About Ice
1. Earth's Changing Cryosphere

This year, we will launch two satellite missions that will increase our understanding of Earth's frozen reaches. Snow, ice sheets, glaciers, sea ice and permafrost, known as the cryosphere, act as Earth's thermostat and deep freeze, regulating temperatures by reflecting heat from the Sun and storing most of our fresh water.
2. GRACE-FO: Building on a Legacy and Forging Ahead

The next Earth science satellites set to launch are twins! The identical satellites of the GRACE Follow-On mission will build on the legacy of their predecessor GRACE by also tracking the ever-changing movement of water around our planet, including Earth's frozen regions. GRACE-FO, a partnership between us and the German Research Center for Geosciences (GFZ), will provide critical information about how the Greenland and Antarctic ice sheets are changing. GRACE-FO, working together, will measure the distance between the two satellites to within 1 micron (much less than the width of a human hair) to determine the mass below.

Greenland has been losing about 280 gigatons of ice per year on average, and Antarctica has lost almost 120 gigatons a year with indications that both melt rates are increasing. A single gigaton of water would fill about 400,000 Olympic-sized swimming pools; each gigaton represents a billion tons of water.
3. ICESat-2: 10,000 Laser Pulses a Second

In September, we will launch ICESat-2, which uses a laser instrument to precisely measure the changing elevation of ice around the world, allowing scientists to see whether ice sheets and glaciers are accumulating snow and ice or getting thinner over time. ICESat-2 will also make critical measurements of the thickness of sea ice from space. Its laser instrument sends 10,000 pulses per second to the surface and will measure the photons' return trip to satellite. The trip from ICESat-2 to Earth and back takes about 3.3 milliseconds.
4. Seeing Less Sea Ice

Summertime sea ice in the Arctic Ocean now routinely covers about 40% less area than it did in the late 1970s, when continuous satellite observations began. This kind of significant change could increase the rate of warming already in progress and affect global weather patterns.
5. The Snow We Drink

In the western United States, 1 in 6 people rely on snowpack for water. Our field campaigns such as the Airborne Snow Observatory and SnowEx seek to better understand how much water is held in Earth's snow cover, and how we could ultimately measure this comprehensively from space.
6. Hidden in the Ground

Permafrost - permanently frozen ground in the Arctic that contains stores of heat-trapping gases such as methane and carbon dioxide - is thawing at faster rates than previously observed. Recent studies suggest that within three to four decades, this thawing could be releasing enough greenhouse gases to make Arctic permafrost a net source of carbon dioxide rather than a sink. Through airborne and field research on missions such as CARVE and ABoVE - the latter of which will put scientists back in the field in Alaska and Canada this summer - our scientists are trying to improve measurements of this trend in order to better predict global impact.
7. Breaking Records Over Cracking Ice

Last year was a record-breaking one for Operation IceBridge, our aerial survey of polar ice. For the first time in its nine-year history, the mission carried out seven field campaigns in the Arctic and Antarctic in a single year. In total, the IceBridge scientists and instruments flew over 214,000 miles, the equivalent of orbiting the Earth 8.6 times at the equator.

On March 22, we completed the first IceBridge flight of its spring Arctic campaign with a survey of sea ice north of Greenland. This year marks the 10th Arctic spring campaign for IceBridge. The flights continue until April 27 extending the mission's decade-long mapping of the fastest-changing areas of the Greenland Ice Sheet and measuring sea ice thickness across the western Arctic basin.
8. OMG

Researchers were back in the field this month in Greenland with our Oceans Melting Greenland survey. The airborne and ship-based mission studies the ocean's role in melting Greenland's ice. Researchers examine temperatures, salinity and other properties of North Atlantic waters along the more than 27,000 miles (44,000 km) of jagged coastline.
9. DIY Glacier Modeling

Computer models are critical tools for understanding the future of a changing planet, including melting ice and rising seas. Our new sea level simulator lets you bury Alaska's Columbia glacier in snow, and, year by year, watch how it responds. Or you can melt the Greenland and Antarctic ice sheets and trace rising seas as they inundate the Florida coast.
10. Ice Beyond Earth

Ice is common in our solar system. From ice packed into comets that cruise the solar system to polar ice caps on Mars to Europa and Enceladus-the icy ocean moons of Jupiter and Saturn-water ice is a crucial ingredient in the search for life was we know it beyond Earth.
Read the full version of this week’s 10 Things to Know HERE.
Make sure to follow us on Tumblr for your regular dose of space: http://nasa.tumblr.com.
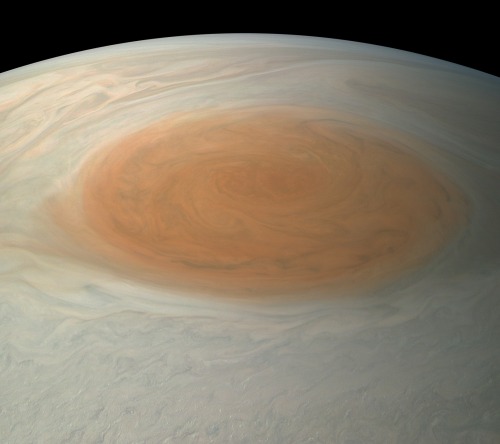
Jupiter's Great Red Spot Getting Taller as it Shrinks
Discover how a team of our scientists has uncovered evidence that Jupiter’s Great Red Spot is growing taller as it gets smaller.
Though once big enough to swallow three Earths with room to spare, Jupiter's Great Red Spot has been shrinking for a century and a half. Nobody is sure how long the storm will continue to contract or whether it will disappear altogether.

A new study suggests that it hasn't all been downhill, though. The storm seems to have increased in area at least once along the way, and it's growing taller as it gets smaller.

Observations of Jupiter date back centuries, but the first confirmed sighting of the Great Red Spot was in 1831. But until then, researchers aren't certain whether earlier observers who saw a red spot on Jupiter were looking at the same storm.

Amy Simon, an expert in planetary atmospheres at our Goddard Space Flight Center in Greenbelt, Maryland, and her team traced the evolution of the Great Red Spot, analyzing its size, shape, color and drift rate. They also looked at the storm's internal wind speeds, when that information was available from spacecraft.

This new study confirms that the storm has been decreasing in diameter overall since 1878 and is now big enough to accommodate just over one Earth at this point. Then again, the historical record indicates the area of the spot grew temporarily in the 1920s. Scientists aren't sure why it grew for a bit.

Because the storm has been contracting, the researchers expected to find the already-powerful internal winds becoming even stronger, like an ice skater who spins faster as she pulls in her arms.

But that's not what is happening. Instead of spinning faster, the storm appears to be forced to stretch up. It's almost like clay being shaped on a potter's wheel. As the wheel spins, an artist can transform a short, round lump into a tall, thin vase by pushing inward with his hands. The smaller he makes the base, the taller the vessel will grow.

The Great Red Spot's color has been deepening, too, becoming is a more intense orange color since 2014. Researchers aren't sure why that's happening, but it's possible that the chemicals coloring the storm are being carried higher into the atmosphere as the spot stretches up. At higher altitudes, the chemicals would be subjected to more UV radiation and would take on a deeper color.

In some ways, the mystery of the Great Red Spot only seems to deepen as the iconic storm gets smaller. Researchers don't know whether the spot will shrink a bit more and then stabilize, or break apart completely.
For more information, go here/watch this:
For the full story, click HERE.
Make sure to follow us on Tumblr for your regular dose of space: http://nasa.tumblr.com.
Solar System: 10 Things to Know This Week
Planets Outside Our Solar System
Let the planet-hunting begin!
Our Transiting Exoplanet Survey Satellite (TESS), which will scan the skies to look for planets beyond our solar system—known as exoplanets—is now in Florida to begin preparations for launch in April. Below, 10 Things to know about the many, many unknown planets out there awaiting our discovery.
1—Exo-what?

We call planets in our solar system, well, planets, but the many planets we’re starting to discover outside of our solar system are called exoplanets. Basically, they’re planets that orbit another star.
2—All eyes on TRAPPIST-1.

Remember the major 2016 announcement that we had discovered seven planets 40 light-years away, orbiting a star called TRAPPIST-1? Those are all exoplanets. (Here’s a refresher.)
3—Add 95 new ones to that.

Just last month, our Kepler telescope discovered 95 new exoplanets beyond our solar system (on top of the thousands of exoplanets Kepler has discovered so far). The total known planet count beyond our solar system is now more than 3,700. The planets range in size from mostly rocky super-Earths and fluffy mini-Neptunes, to Jupiter-like giants. They include a new planet orbiting a very bright star—the brightest star ever discovered by Kepler to have a transiting planet.
4—Here comes TESS.

How many more exoplanets are out there waiting to be discovered? TESS will monitor more than 200,000 of the nearest and brightest stars in search of transit events—periodic dips in a star’s brightness caused by planets passing in front—and is expected to find thousands of exoplanets.
5—With a sidekick, too.

Our upcoming James Webb Space Telescope, will provide important follow-up observations of some of the most promising TESS-discovered exoplanets. It will also allow scientists to study their atmospheres and, in some special cases, search for signs that these planets could support life.
6—Prepped for launch.

TESS is scheduled to launch on a SpaceX Falcon 9 rocket from Cape Canaveral Air Force Station nearby our Kennedy Space Center in Florida, no earlier than April 16, pending range approval.
7—A groundbreaking find.

In 1995, 51 Pegasi b (also called "Dimidium") was the first exoplanet discovered orbiting a star like our Sun. This find confirmed that planets like the ones in our solar system could exist elsewhere in the universe.
8—Trillions await.

A recent statistical estimate places, on average, at least one planet around every star in the galaxy. That means there could be a trillion planets in our galaxy alone, many of them in the range of Earth’s size.
9—Signs of life.

Of course, our ultimate science goal is to find unmistakable signs of current life. How soon can that happen? It depends on two unknowns: the prevalence of life in the galaxy and a bit of luck. Read more about the search for life.
10—Want to explore the galaxy?

No need to be an astronaut. Take a trip outside our solar system with help from our Exoplanet Travel Bureau.
Read the full version of this week’s ‘10 Things to Know’ article HERE.
Make sure to follow us on Tumblr for your regular dose of space: http://nasa.tumblr.com.
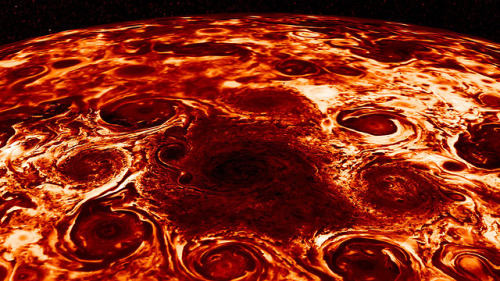
With unearthly jet-streams, many massive swirling cyclones and winds running deep into its atmosphere — new data from our Juno Mission to Jupiter unveils discoveries and clues about the gas-giant planet.
This composite image, derived from data collected by the Jovian Infrared Auroral Mapper (JIRAM) instrument aboard our Juno spacecraft, shows the central cyclone at the planet’s north pole and the eight cyclones that encircle it.
However, as tightly spaced as the cyclones are, they have remained distinct, with individual morphologies over the seven months of observations. The question is, why do they not merge? We are beginning to realize that not all gas giants are created equal.
Read more about these discoveries HERE.
Make sure to follow us on Tumblr for your regular dose of space: http://nasa.tumblr.com.

During a recent close flyby of the gas giant Jupiter, our Juno spacecraft captured this stunning series of images showing swirling cloud patterns on the planet’s south pole. At first glance, the series might appear to be the same image repeated. But closer inspection reveals slight changes, which are most easily noticed by comparing the far-left image with the far-right image.
Directly, the images show Jupiter. But, through slight variations in the images, they indirectly capture the motion of the Juno spacecraft itself, once again swinging around a giant planet hundreds of millions of miles from Earth.
Juno captured this color-enhanced time-lapse sequence of images on Feb. 7 between 10:21 a.m. and 11:01 a.m. EST. At the time, the spacecraft was between 85,292 to 124,856 miles (137,264 to 200,937 kilometers) from the tops of the clouds of the planet with the images centered on latitudes from 84.1 to 75.5 degrees south.
Credit: NASA/JPL-Caltech/SwRI/MSSS/Gerald Eichstädt
Make sure to follow us on Tumblr for your regular dose of space: http://nasa.tumblr.com.
Solar System: 10 Things to Know This Week
January 8: Images for Your Computer or Phone Wallpaper
Need some fresh perspective? Here are 10 vision-stretching images for your computer desktop or phone wallpaper. These are all real pictures, sent recently by our planetary missions throughout the solar system. You'll find more of our images at solarsystem.nasa.gov/galleries, images.nasa.gov and www.jpl.nasa.gov/spaceimages.
Applying Wallpaper: 1. Click on the screen resolution you would like to use. 2. Right-click on the image (control-click on a Mac) and select the option 'Set the Background' or 'Set as Wallpaper' (or similar).
1. The Fault in Our Mars

This image from our Mars Reconnaissance Orbiter (MRO) of northern Meridiani Planum shows faults that have disrupted layered deposits. Some of the faults produced a clean break along the layers, displacing and offsetting individual beds.
Desktop: 1280 x 800 | 1600 x 1200 | 1920 x 1200 Mobile: 1440 x 2560 | 1080 x 1920 | 750 x 1334
2. Jupiter Blues

Our Juno spacecraft captured this image when the spacecraft was only 11,747 miles (18,906 kilometers) from the tops of Jupiter's clouds -- that's roughly as far as the distance between New York City and Perth, Australia. The color-enhanced image, which captures a cloud system in Jupiter's northern hemisphere, was taken on Oct. 24, 2017, when Juno was at a latitude of 57.57 degrees (nearly three-fifths of the way from Jupiter's equator to its north pole) and performing its ninth close flyby of the gas giant planet.
Desktop: 1280 x 800 | 1600 x 1200 | 1920 x 1200 Mobile: 1440 x 2560 | 1080 x 1920 | 750 x 1334
3. A Farewell to Saturn

After more than 13 years at Saturn, and with its fate sealed, our Cassini spacecraft bid farewell to the Saturnian system by firing the shutters of its wide-angle camera and capturing this last, full mosaic of Saturn and its rings two days before the spacecraft's dramatic plunge into the planet's atmosphere on Sept. 15, 2017.
Desktop: 1280 x 800 | 1600 x 1200 | 1920 x 1200 Mobile: 1440 x 2560 | 1080 x 1920 | 750 x 1334
4. All Aglow

Saturn's moon Enceladus drifts before the rings, which glow brightly in the sunlight. Beneath its icy exterior shell, Enceladus hides a global ocean of liquid water. Just visible at the moon's south pole (at bottom here) is the plume of water ice particles and other material that constantly spews from that ocean via fractures in the ice. The bright speck to the right of Enceladus is a distant star. This image was taken in visible light with the Cassini spacecraft narrow-angle camera on Nov. 6, 2011.
Desktop: 1280 x 800 | 1600 x 1200 | 1920 x 1200 Mobile: 1440 x 2560 | 1080 x 1920 | 750 x 1334
5. Rare Encircling Filament

Our Solar Dynamics Observatory came across an oddity this week that the spacecraft has rarely observed before: a dark filament encircling an active region (Oct. 29-31, 2017). Solar filaments are clouds of charged particles that float above the Sun, tethered to it by magnetic forces. They are usually elongated and uneven strands. Only a handful of times before have we seen one shaped like a circle. (The black area to the left of the brighter active region is a coronal hole, a magnetically open region of the Sun).
Desktop: 1280 x 800 | 1600 x 1200 | 1920 x 1200 Mobile: 1440 x 2560 | 1080 x 1920 | 750 x 1334
6. Jupiter's Stunning Southern Hemisphere

See Jupiter's southern hemisphere in beautiful detail in this image taken by our Juno spacecraft. The color-enhanced view captures one of the white ovals in the "String of Pearls," one of eight massive rotating storms at 40 degrees south latitude on the gas giant planet. The image was taken on Oct. 24, 2017, as Juno performed its ninth close flyby of Jupiter. At the time the image was taken, the spacecraft was 20,577 miles (33,115 kilometers) from the tops of the clouds of the planet.
Desktop: 1280 x 800 | 1600 x 1200 | 1920 x 1200 Mobile: 1440 x 2560 | 1080 x 1920 | 750 x 1334
7. Saturn's Rings: View from Beneath

Our Cassini spacecraft obtained this panoramic view of Saturn's rings on Sept. 9, 2017, just minutes after it passed through the ring plane. The view looks upward at the southern face of the rings from a vantage point above Saturn's southern hemisphere.
Desktop: 1280 x 800 | 1600 x 1200 | 1920 x 1200 Mobile: 1440 x 2560 | 1080 x 1920 | 750 x 1334
8. From Hot to Hottest

This sequence of images from our Solar Dynamics Observatory shows the Sun from its surface to its upper atmosphere all taken at about the same time (Oct. 27, 2017). The first shows the surface of the sun in filtered white light; the other seven images were taken in different wavelengths of extreme ultraviolet light. Note that each wavelength reveals somewhat different features. They are shown in order of temperature, from the first one at about 11,000 degrees Fahrenheit (6,000 degrees Celsius) on the surface, out to about 10 million degrees in the upper atmosphere. Yes, the sun's outer atmosphere is much, much hotter than the surface. Scientists are getting closer to solving the processes that generate this phenomenon.
Desktop: 1280 x 800 | 1600 x 1200 | 1920 x 1200 Mobile: 1440 x 2560 | 1080 x 1920 | 750 x 1334
9. High Resolution View of Ceres

This orthographic projection shows dwarf planet Ceres as seen by our Dawn spacecraft. The projection is centered on Occator Crater, home to the brightest area on Ceres. Occator is centered at 20 degrees north latitude, 239 degrees east longitude.
Desktop: 1280 x 800 | 1600 x 1200 | 1920 x 1200 Mobile: 1440 x 2560 | 1080 x 1920 | 750 x 1334
10. In the Chasm

This image from our Mars Reconnaissance Orbiter shows a small portion of the floor of Coprates Chasma, a large trough within the Valles Marineris system of canyons. Although the exact sequence of events that formed Coprates Chasma is unknown, the ripples, mesas, and craters visible throughout the terrain point to a complex history involving multiple mechanisms of erosion and deposition. The main trough of Coprates Chasma ranges from 37 miles (60 kilometers) to 62 miles (100 kilometers) in width.
Desktop: 1280 x 800 | 1600 x 1200 | 1920 x 1200 Mobile: 1440 x 2560 | 1080 x 1920 | 750 x 1334
Explore and learn more about our solar system at: solarsystem.nasa.gov/.
Make sure to follow us on Tumblr for your regular dose of space: http://nasa.tumblr.com.
What in the Universe is an Exoplanet?
Simply put, an exoplanet is a planet that orbits another star.
All of the planets in our solar system orbit around the Sun. Planets that orbit around other stars outside our solar system are called exoplanets.

Just because a planet orbits a star (like Earth) does not mean that it is automatically stable for life. The planet must be within the habitable zone, which is the area around a star in which water has the potential to be liquid…aka not so close that all the water would evaporate, and not too far away where all the water would freeze.

Exoplanets are very hard to see directly with telescopes. They are hidden by the bright glare of the stars they orbit. So, astronomers use other ways to detect and study these distant planets by looking at the effects these planets have on the stars they orbit.

One way to search for exoplanets is to look for "wobbly" stars. A star that has planets doesn’t orbit perfectly around its center. From far away, this off-center orbit makes the star look like it’s wobbling. Hundreds of planets have been discovered using this method. However, only big planets—like Jupiter, or even larger—can be seen this way. Smaller Earth-like planets are much harder to find because they create only small wobbles that are hard to detect.
How can we find Earth-like planets in other solar systems?
In 2009, we launched a spacecraft called Kepler to look for exoplanets. Kepler looked for planets in a wide range of sizes and orbits. And these planets orbited around stars that varied in size and temperature.

Kepler detected exoplanets using something called the transit method. When a planet passes in front of its star, it’s called a transit. As the planet transits in front of the star, it blocks out a little bit of the star's light. That means a star will look a little less bright when the planet passes in front of it. Astronomers can observe how the brightness of the star changes during a transit. This can help them figure out the size of the planet.

By studying the time between transits, astronomers can also find out how far away the planet is from its star. This tells us something about the planet’s temperature. If a planet is just the right temperature, it could contain liquid water—an important ingredient for life.
So far, thousands of planets have been discovered by the Kepler mission.
We now know that exoplanets are very common in the universe. And future missions have been planned to discover many more!
Next month, we’re launching an explorer-class planet finder — the Transiting Exoplanet Survey Satellite (TESS). This mission will search the entire sky for exoplanets — planets outside our solar system that orbit sun-like stars.
Make sure to follow us on Tumblr for your regular dose of space: http://nasa.tumblr.com.
Solar System: Things to Know This Week
Our Juno mission has been exploring Jupiter since July 2016 with a special passenger on board: JunoCam, an instrument designed to take spectacular close-up color images of the largest planet in our solar system. From the raw images, citizen scientists have processed a range of beautiful photographs that highlight Jupiter's features, even turning them into works of art. Below, 10 stunning images JunoCam has given us over the past year.
1. Jovian tempest.

This color-enhanced image of a massive, raging storm in Jupiter's northern hemisphere was captured by our Juno spacecraft during its ninth close flyby on Oct. 24, 2017. The storm is rotating counter-clockwise with a wide range of cloud altitudes, and the darker clouds are expected to be deeper in the atmosphere than the brightest clouds.
2. A southern stunner.

Jupiter's southern hemisphere shows off in beautiful detail in this image taken on Oct. 24, 2017. The color-enhanced view captures one of the white ovals in the "String of Pearls," one of eight massive rotating storms at 40 degrees south latitude on the gas giant planet.
3. Dreaming in color.

Artist Mik Petter created this unique digital piece using data from the JunoCam. The art form, known as fractals, uses mathematical formulas to create an infinite variety of form, detail, color and light. The original JunoCam image was taken on July 10, 2017.
4. Jovian moon shadow.

Jupiter's moon Amalthea casts a shadow on the gas giant planet in this image taken on Sept. 1, 2017. The elongated shape of the shadow is a result of both the location of the moon with relation to Jupiter in this image as well as the irregular shape of the moon itself.
5. 95 minutes over Jupiter.

Once every 53 days, Juno swings close to Jupiter, speeding over its clouds. In about two hours, the spacecraft travels from a perch over Jupiter's north pole through its closest approach (perijove), then passes over the south pole on its way back out. This sequence shows 11 color-enhanced images from Perijove 8 (Sept. 1, 2017) with the south pole on the left (11th image in the sequence) and the north pole on the right (first image in the sequence).
6. Soaring high.
This striking image of Jupiter was taken on Sept. 1, 2017 as Juno performed its eighth flyby. The spacecraft was 4,707 miles (7,576 kilometers) from the tops of the clouds of the planet at a latitude of about -17.4 degrees. Noteworthy: "Whale's Tail" and "Dan's Spot."
7. In true color.
This true-color image offers a natural color rendition of what the Great Red Spot and surrounding areas would look like to human eyes from Juno's position. The image was taken on July 10, 2017 as the Juno spacecraft performed its seventh close flyby of Jupiter.
8. The 'face' of Jupiter.

JunoCam images aren't just for art and science—sometimes they're created for a good chuckle. This image, processed by citizen scientist Jason Major, is titled "Jovey McJupiterface." By rotating the image 180 degrees and orienting it from south up, two white oval storms turn into eyeballs, and the "face" of Jupiter is revealed. The original image was taken by the Juno spacecraft on May 19, 2017.
9. Bands of clouds.

This enhanced-color image of Jupiter's bands of light and dark clouds was created by citizen scientists Gerald Eichstädt and Seán Doran. Three of the white oval storms known as the "String of Pearls" are visible near the top of the image. Each of the alternating light and dark atmospheric bands in this image is wider than Earth, and each rages around Jupiter at hundreds of miles (kilometers) per hour. The lighter areas are regions where gas is rising, and the darker bands are regions where gas is sinking. Juno captured the image on May 19, 2017.
10. The edge.

This enhanced-color image of a mysterious dark spot on Jupiter seems to reveal a Jovian "galaxy" of swirling storms. Juno captured this image on Feb. 2, 2017 and citizen scientist Roman Tkachenko enhanced the color to bring out the rich detail in the storm and surrounding clouds. Just south of the dark storm is a bright, oval-shaped storm with high, bright, white clouds, reminiscent of a swirling galaxy. As a final touch, he rotated the image 90 degrees, turning the picture into a work of art.
To learn more about the Juno mission at Jupiter, visit: www.nasa.gov/juno.
Follow the Juno mission on Facebook, Instagram and Twitter.
Make sure to follow us on Tumblr for your regular dose of space: http://nasa.tumblr.com.
From Microscopic to Multicellular: Six Stories of Life that We See from Space
Life. It's the one thing that, so far, makes Earth unique among the thousands of other planets we've discovered. Since the fall of 1997, NASA satellites have continuously and globally observed all plant life at the surface of the land and ocean. During the week of Nov. 13-17, we are sharing stories and videos about how this view of life from space is furthering knowledge of our home planet and the search for life on other worlds.

Earth is the only planet with life, as far as we know. From bacteria in the crevices of the deepest oceans to monkeys swinging between trees, Earth hosts life in all different sizes, shapes and colors. Scientists often study Earth from the ground, but some also look to our satellites to understand how life waxes and wanes on our planet.
Over the years, scientists have used this aerial view to study changes in animal habitats, track disease outbreaks, monitor forests and even help discover a new species. While this list is far from comprehensive, these visual stories of bacteria, plants, land animals, sea creatures and birds show what a view from space can reveal.
1. Monitoring the single-celled powerhouses of the sea

Known as the grass of the ocean, phytoplankton are one of the most abundant types of life in the ocean. Usually single-celled, these plant-like organisms are the base of the marine food chain. They are also responsible for the only long-term transfer of carbon dioxide from Earth’s atmosphere to the ocean.
Even small changes in phytoplankton populations can affect carbon dioxide concentrations in the atmosphere, which could ultimately affect Earth’s global surface temperatures. Scientists have been observing global phytoplankton populations continuously since 1997 starting with the Sea-Viewing Wide Field-of View Sensor (SeaWiFS). They continue to study the small life-forms by satellite, ships and aircrafts.
2. Predicting cholera bacteria outbreaks
Found on the surface of zooplankton and in contaminated water, the bacteria that cause the infectious disease cholera — Vibrio cholerae — affect millions of people every year with severe diarrhea, sometimes leading to death. While our satellite sensors can’t detect the actual bacteria, scientists use various satellite data to look for the environmental conditions that the bacteria thrive in.
Specifically, microbiologist Rita Colwell at the University of Maryland, College Park, and West Virginia University hydrologist Antar Jutla studied data showing air and ocean temperature, salinity, precipitation, and chlorophyllconcentrations, the latter a marker for zooplankton. Anticipating where the bacteria will bloom helps researchers to mitigate outbreaks.

Recently, Colwell and Jutla have been able to estimate cholera risk after major events, such as severe storms, by looking at satellite precipitation data, air temperature, and population maps. The two maps above show the team's predicted cholera risk in Haiti two weeks after Hurricane Matthew hit over October 1-2, 2016 and the actual reported cholera cases in October 2016.
3. Viewing life on land
From helping preserve forests for chimpanzees to predicting deer population patterns, scientists use our satellites to study wildlife across the world. Satellites can also see the impacts of perhaps the most relatable animal to us: humans. Every day, we impact our planet in many ways including driving cars, constructing buildings and farming – all of which we can see with satellites.

Our Black Marble image provides a unique view of human activity. Looking at trends in our lights at night, scientists can study how cities develop over time, how lighting and activity changes during certain seasons and holidays, and even aid emergency responders during power outages caused by natural disasters.
4. Tracking bird populations
Scientists use our satellite data to study birds in a variety of ways, from understanding their migratory patterns, to spotting potential nests, to tracking populations. In a rather creative application, scientists used satellite imagery to track Antarctica’s emperor penguin populations by looking for their guano – or excrement.

Counting emperor penguins from the ground perspective is challenging because they breed in some of the most remote and cold places in the world, and in colonies too large to easily count manually. With their black and white coats, emperor penguins are also difficult to count from an aerial view as they sometimes blend in with shadows on the ice. Instead, Phil Trathan and his colleagues at the British Antarctic Survey looked through Landsat imagery for brown stains on the sea ice. By looking for penguin droppings, Trathan said his team identified 54 emperor penguin colonies along the Antarctic coast.
5. Parsing out plant life
Just as we see plants grow and wilt on the ground, satellites observe the changes from space. Flourishing vegetation can indicate a lively ecosystem while changes in greenery can sometimes reveal natural disasters, droughts or even agricultural practices. While satellites can observe plant life in our backyards, scientists can also use them to provide a global picture.

Using data from satellites including SeaWiFS, and instruments including the NASA/NOAA Visible Infrared Imaging Radiometer Suite and the Moderate Resolution Imaging Spectroradiometer, scientists have the most complete view of global biology to date, covering all of the plant life on land and at the surface of the ocean.
6. Studying life under the sea
Our satellites have helped scientists study creatures living in the oceans whether it’s finding suitable waters for oysters or protecting the endangered blue whale. Scientists also use the data to learn more about one of the most vulnerable ecosystems on the planet – coral reefs.

They may look like rocks or plants on the seafloor, but corals are very much living animals. Receiving sustenance from photosynthetic plankton living within their calcium carbonate structures, coral reefs provide food and shelter for many kinds of marine life, protect shorelines from storms and waves, serve as a source for potential medicines, and operate as some of the most diverse ecosystems on the planet.

However, coral reefs are vulnerable to the warming of the ocean and human activity. Our satellites measure the surface temperature of ocean waters. These measurements have revealed rising water temperatures surrounding coral reef systems around the world, which causes a phenomenon known as “coral bleaching.” To add to the satellite data, scientists use measurements gathered by scuba divers as well as instruments flown on planes.
During the week of Nov. 13-17, check out our stories and videos about how this view of life from space is furthering knowledge of our home planet and the search for life on other worlds. Follow at www.nasa.gov/Earth.
Make sure to follow us on Tumblr for your regular dose of space: http://nasa.tumblr.com.
Solar System: 10 Things to Know This Week
The Living Planet Edition
Whether it's crops, forests or phytoplankton blooms in the ocean, our scientists are tracking life on Earth. Just as satellites help researchers study the atmosphere, rainfall and other physical characteristics of the planet, the ever-improving view from above allows them to study Earth's interconnected life.
1. Life on Earth, From Space

While we (NASA) began monitoring life on land in the 1970s with the Landsat satellites, this fall marks 20 years since we've continuously observed all the plant life at the surface of both the land and ocean. The above animation captures the entirety of two decades of observations.
2. Watching the World Breathe
With the right tools, we can see Earth breathe. With early weather satellite data in the 1970s and '80s, NASA Goddard scientist Compton Tucker was able to see plants' greening and die-back from space. He developed a way of comparing satellite data in two wavelengths.

When healthy plants are stocked with chlorophyll and ready to photosynthesize to make food (and absorb carbon dioxide), leaves absorb red light but reflect infrared light back into space. By comparing the ratio of red to infrared light, Tucker and his colleagues could quantify vegetation covering the land.
Expanding the study to the rest of the globe, the scientists could track rainy and dry seasons in Africa, see the springtime blooms in North America, and wildfires scorching forests worldwide.
3. Like Breathing? Thank Earth's Ocean

But land is only part of the story. The ocean is home to 95 percent of Earth's living space, covering 70 percent of the planet and stretching miles deep. At the base of the ocean's food web is phytoplankton - tiny plants that also undergo photosynthesis to turn nutrients and carbon dioxide into sugar and oxygen. Phytoplankton not only feed the rest of ocean life, they absorb carbon dioxide - and produce about half the oxygen we breathe.

In the Arctic Ocean, an explosion of phytoplankton indicates change. As seasonal sea ice melts, warming waters and more sunlight will trigger a sudden, massive phytoplankton bloom that feeds birds, sea lions and newly-hatched fish. But with warming atmospheric temperatures, that bloom is now happening several weeks earlier - before the animals are in place to take advantage of it.
4. Keeping an Eye on Crops
The "greenness" measurement that scientists use to measure forests and grasslands can also be used to monitor the health of agricultural fields. By the 1980s, food security analysts were approaching NASA to see how satellite images could help with the Famine Early Warning System to identify regions at risk - a partnership that continues today.

With rainfall estimates, vegetation measurements, as well as the recent addition of soil moisture information, our scientists can help organizations like USAID direct emergency help.
The view from space can also help improve agricultural practices. A winery in California, for example, uses individual pixels of Landsat data to determine when to irrigate and how much water to use.
5. Coming Soon to the International Space Station

A laser-based instrument being developed for the International Space Station will provide a unique 3-D view of Earth's forests. The instrument, called GEDI, will be the first to systematically probe the depths of the forests from space.

Another ISS instrument in development, ECOSTRESS, will study how effectively plants use water. That knowledge provided on a global scale from space will tell us "which plants are going to live or die in a future world of greater droughts," said Josh Fisher, a research scientist at NASA's Jet Propulsion Laboratory and science lead for ECOSTRESS.
6. Seeing Life, From the Microscopic to Multicellular
Scientists have used our vantage from space to study changes in animal habitats, track disease outbreaks, monitor forests and even help discover a new species. Bacteria, plants, land animals, sea creatures and birds reveal a changing world.

Our Black Marble image provides a unique view of human activity. Looking at trends in our lights at night, scientists can study how cities develop over time, how lighting and activity changes during certain seasons and holidays, and even aid emergency responders during power outages caused by natural disasters.
7. Earth as Analog and Proving Ground
Just as our Mars rovers were tested in Earth's deserts, the search for life on ocean moons in our solar system is being refined by experiments here. JPL research scientist Morgan Cable looks for life on the moons of Jupiter and Saturn. She cites satellite observations of Arctic and Antarctic ice fields that are informing the planning for a future mission to Europa, an icy moon of Jupiter.

The Earth observations help researchers find ways to date the origin of jumbled, chaotic ice. "When we visit Europa, we want to go to very young places, where material from that ocean is being expressed on the surface," she explained. "Anywhere like that, the chances of finding biomarkers goes up - if they're there."
8. Only One Living Planet
Today, we know of only one living planet: our own. The knowledge and tools NASA developed to study life here are among our greatest assets as we begin the search for life beyond Earth.

There are two main questions: With so many places to look, how can we home in on the places most likely to harbor life? What are the unmistakable signs of life - even if it comes in a form we don't fully understand? In this early phase of the search, "We have to go with the only kind of life we know," said Tony del Genio, co-lead of a new NASA interdisciplinary initiative to search for life on other worlds.

So, the focus is on liquid water. Even bacteria around deep-sea vents that don't need sunlight to live need water. That one necessity rules out many planets that are too close or too far from their stars for water to exist, or too far from us to tell. Our Galileo and Cassini missions revealed that some moons of Jupiter and Saturn are not the dead rocks astronomers had assumed, but appear to have some conditions needed for life beneath icy surfaces.
9. Looking for Life Beyond Our Solar System
In the exoplanet (planets outside our solar system that orbit another star) world, it's possible to calculate the range of distances for any star where orbiting planets could have liquid water. This is called the star's habitable zone. Astronomers have already located some habitable-zone planets, and research scientist Andrew Rushby of NASA Ames Research Center is researching ways to refine the search. "An alien would spot three planets in our solar system in the habitable zone [Earth, Mars and Venus]," Rushby said, "but we know that 67 percent of those planets are not inhabited."

He recently developed a model of Earth's carbon cycle and combined it with other tools to study which planets in habitable zones would be the best targets to look for life, considering probable tectonic activity and water cycles. He found that larger planets are more likely than smaller ones to have surface temperatures conducive to liquid water. Other exoplanet researchers are looking for rocky worlds, and biosignatures, the chemical signs of life.
10. You Can Learn a Lot from a Dot
When humans start collecting direct images of exoplanets, even the closest ones will appear as only a handful of pixels in the detector - something like the famous "blue dot" image of Earth from Saturn. What can we learn about life on these planets from a single dot?

Stephen Kane of the University of California, Riverside, has come up with a way to answer that question by using our EPIC camera on NOAA's DSCOVR satellite. "I'm taking these glorious pictures and collapsing them down to a single pixel or handful of pixels," Kane explained. He runs the light through a noise filter that attempts to simulate the interference expected from an exoplanet mission. By observing how the brightness of Earth changes when mostly land is in view compared with mostly water, Kane reverse-engineers Earth's rotation rate - something that has yet to be measured directly for exoplanets.
The most universal, most profound question about any unknown world is whether it harbors life. The quest to find life beyond Earth is just beginning, but it will be informed by the study of our own living planet.
Make sure to follow us on Tumblr for your regular dose of space: http://nasa.tumblr.com.
Taking the Vital Signs of Mars
Does Mars have quakes? What is the temperature of the Red Planet? How did Mars even form? What can it tell us about how other rocky planets formed?
The Mars InSight lander is scheduled to launch in May 2018 to search for the answers to those questions.

InSight (Interior Exploration using Seismic Investigations, Geodesy and Heat Transport) will conduct the first thorough “check-up” of Mars in more than 4.5 billion years, measuring its “pulse”, or seismic activity; its temperature; and its “reflexes” (the way the planet wobbles when it is pulled by the Sun and its moons).
How and Why?

By using sophisticated instruments – tools that can measure the vital signs of a planet – InSight will delve deep beneath the surface of Mars, detecting the clues left by the earliest stages of planetary formation.

Previous Mars missions have explored the surface history of the Red Planet. Mars has been less geologically active than Earth, so it retains a more complete record of its history in its core, mantle and crust. InSight will study the sizes, densities and overall structure of the Red Planet’s core, mantle and crust.

The lander will also measure the rate at which heat escapes from the planet’s interior, and provide glimpses into the evolutionary processes of all the rocky planets in our solar system, including Earth, and even those circling other stars!

Send Your Name to Mars!

You can send your name to Mars onboard the InSight lander! The deadline to get your Martian boarding pass is Nov. 1. To submit your name, visit: mars.nasa.gov/syn/insight
Learn more about Mars InSight HERE.
Make sure to follow us on Tumblr for your regular dose of space: http://nasa.tumblr.com.
Solar System: 10 Things to Know This Week
Need some space?
Here are 10 perspective-building images for your computer desktop and mobile device wallpaper.
These are all real images, sent very recently by our planetary missions throughout the solar system.
1. Our Sun

Warm up with this view from our Solar Dynamics Observatory showing active regions on the Sun in October 2017. They were observed in a wavelength of extreme ultraviolet light that reveals plasma heated to over a million degrees.
Downloads Desktop: 1280 x 800 | 1600 x 1200 | 1920 x 1200 Mobile: 1440 x 2560 | 1080 x 1920 | 750 x 1334
2. Jupiter Up-Close

This series of enhanced-color images shows Jupiter up close and personal, as our Juno spacecraft performed its eighth flyby of the gas giant planet on Sept. 1, 2017.
Downloads Desktop: 1280 x 800 | 1600 x 1200 | 1920 x 1200 Mobile: 1440 x 2560 | 1080 x 1920 | 750 x 1334
3. Saturn’s and Its Rings

With this mosaic from Oct. 28, 2016, our Cassini spacecraft captured one of its last looks at Saturn and its main rings from a distance.
Downloads Desktop: 1280 x 800 | 1600 x 1200 | 1920 x 1200 Mobile: 1440 x 2560 | 1080 x 1920 | 750 x 1334
4. Gale Crater on Mars

This look from our Curiosity Mars rover includes several geological layers in Gale crater to be examined by the mission, as well as the higher reaches of Mount Sharp beyond. The redder rocks of the foreground are part of the Murray formation. Pale gray rocks in the middle distance of the right half of the image are in the Clay Unit. A band between those terrains is "Vera Rubin Ridge," where the rover is working currently. The view combines six images taken with the rover's Mast Camera (Mastcam) on Jan. 24, 2017.
Downloads Desktop: 1280 x 800 | 1600 x 1200 | 1920 x 1200 Mobile: 1440 x 2560 | 1080 x 1920 | 750 x 1334
5. Sliver of Saturn

Cassini peers toward a sliver of Saturn's sunlit atmosphere while the icy rings stretch across the foreground as a dark band on March 31, 2017. This view looks toward the unilluminated side of the rings from about 7 degrees below the ring plane.
Downloads Desktop: 1280 x 800 | 1600 x 1200 | 1920 x 1200 Mobile: 1440 x 2560 | 1080 x 1920 | 750 x 1334
6. Dwarf Planet Ceres

This image of the limb of dwarf planet Ceres shows a section of the northern hemisphere, as seen by our Dawn mission. Prominently featured is Occator Crater, home of Ceres' intriguing "bright spots." The latest research suggests that the bright material in this crater is comprised of salts left behind after a briny liquid emerged from below.
Downloads Desktop: 1280 x 800 | 1600 x 1200 | 1920 x 1200 Mobile: 1440 x 2560 | 1080 x 1920 | 750 x 1334
7. Martian Crater

This image from our Mars Reconnaissance Orbiter (MRO) shows a crater in the region with the most impressive known gully activity in Mars' northern hemisphere. Gullies are active in the winter due to carbon dioxide frost, but northern winters are shorter and warmer than southern winters, so there is less frost and less gully activity.
Downloads Desktop: 1280 x 800 | 1600 x 1200 | 1920 x 1200 Mobile: 1440 x 2560 | 1080 x 1920 | 750 x 1334
8. Dynamic Storm on Jupiter

A dynamic storm at the southern edge of Jupiter's northern polar region dominates this Jovian cloudscape, courtesy of Juno. This storm is a long-lived anticyclonic oval named North North Temperate Little Red Spot 1. Citizen scientists Gerald Eichstädt and Seán Doran processed this image using data from the JunoCam imager.
Downloads Desktop: 1280 x 800 | 1600 x 1200 | 1920 x 1200 Mobile: 1440 x 2560 | 1080 x 1920 | 750 x 1334
9. Rings Beyond Saturn’s Sunlit Horizon

This false-color view from the Cassini spacecraft gazes toward the rings beyond Saturn's sunlit horizon. Along the limb (the planet's edge) at left can be seen a thin, detached haze.
Downloads Desktop: 1280 x 800 | 1600 x 1200 | 1920 x 1200 Mobile: 1440 x 2560 | 1080 x 1920 | 750 x 1334
10. Saturn’s Ocean-Bearing Moon Enceladus

Saturn's active, ocean-bearing moon Enceladus sinks behind the giant planet in a farewell portrait from Cassini. This view of Enceladus was taken by NASA's Cassini spacecraft on Sept. 13, 2017. It is among the last images Cassini sent back before its mission came to an end on Sept. 15, after nearly 20 years in space.
Downloads Desktop: 1280 x 800 | 1600 x 1200 | 1920 x 1200 Mobile: 1440 x 2560 | 1080 x 1920 | 750 x 1334
Applying Wallpaper: 1. Click on the screen resolution you would like to use. 2. Right-click on the image (control-click on a Mac) and select the option 'Set the Background' or 'Set as Wallpaper' (or similar).
Places to look for more of our pictures include solarsystem.nasa.gov/galleries, images.nasa.gov and www.jpl.nasa.gov/spaceimages.
Make sure to follow us on Tumblr for your regular dose of space: http://nasa.tumblr.com
After 20 years in space, the Cassini spacecraft is running out of fuel. In 2010, Cassini began a seven-year mission extension in which the plan was to expend all of the spacecraft’s propellant exploring Saturn and its moons. This led to the Grand Finale and ends with a plunge into the planet’s atmosphere at 6:32 a.m. EDT on Friday, Sept. 15.
The spacecraft will ram through Saturn’s atmosphere at four times the speed of a re-entry vehicle entering Earth’s atmosphere, and Cassini has no heat shield. So temperatures around the spacecraft will increase by 30-to-100 times per minute, and every component of the spacecraft will disintegrate over the next couple of minutes…
Cassini’s gold-colored multi-layer insulation blankets will char and break apart, and then the spacecraft's carbon fiber epoxy structures, such as the 11-foot (3-meter) wide high-gain antenna and the 30-foot (11-meter) long magnetometer boom, will weaken and break apart. Components mounted on the outside of the central body of the spacecraft will then break apart, followed by the leading face of the spacecraft itself.
Make sure to follow us on Tumblr for your regular dose of space: http://nasa.tumblr.com.
Solar System: Things to Know This Week
Go for Venus! Fifty-five years ago this week, Mariner 2, the first fully successful mission to explore another planet launched from Cape Canaveral in Florida. Here are 10 things to know about Mariner 2.
1. Interplanetary Cruise

On August 27, 1962, Mariner 2 launched on a three and a half month journey to Venus. The little spacecraft flew within 22,000 miles (about 35,000 kilometers) of the planet.
2. Quick Study

Mariner 2's scan of Venus lasted only 42 minutes. And, like most of our visits to new places, the mission rewrote the books on what we know about Earth's sister planet.
3. Hot Planet

The spacecraft showed that surface temperature on Venus was hot enough to melt lead: at least 797 degrees Fahrenheit (425 degrees Celsius) on both the day and night sides.
4. Continuous Clouds
The clouds that make Venus shine so bright in Earth's skies are dozens of miles thick and permanent. It's always cloudy on Venus, and the thick clouds trap heat - contributing to a runaway "greenhouse effect."
5. Night Light

Those clouds are why Venus shines so brightly in Earth's night sky. The clouds reflect and scatter sunlight, making Venus second only to our Moon in celestial brightness.
6. Under Pressure
Venus' clouds also create crushing pressure. Mariner 2's scan revealed pressure on the surface of Venus is equal to pressure thousands of feet under Earth's deepest oceans.
7. Slow Turn
Mariner 2 found Venus rotates very slowly, and in the opposite direction of most planets in our solar system.
8. Space Travel Is Tough
Mariner 2 was a remarkable accomplishment, considering that in 1962 engineers were still in the very early stages of figuring out how operate spacecraft beyond Earth orbit. The first five interplanetary missions launched - by the U.S. and Soviet Union, the only two spacefaring nations at the time - were unsuccessful.
9. Not Ready for Its Close Up
Mariner 2 carried no cameras. The first close-up pictures of Venus came from NASA's Mariner 10 in 1974.
10. Hot Shot

The first (and still incredibly rare) photo of the surface of Venus was taken by the Soviet Venera 9 lander, which survived for a little more than a minute under the crushing pressure and intense heat on the ground.
Make sure to follow us on Tumblr for your regular dose of space: http://nasa.tumblr.com
From the unique vantage point of about 25,000 feet above Earth, our Associate Administrator of Science at NASA, Dr. Thomas Zurbuchen, witnessed the 2017 eclipse. He posted this video to his social media accounts saying, “At the speed of darkness...watch as #SolarEclipse2017 shadow moves across our beautiful planet at <1 mile/second; as seen from GIII aircraft”.
Zurbuchen, along with NASA Acting Administrator Robert Lightfoot, Associate Administrator Lesa Roe traveled on a specially modified Gulfstream III aircraft flying north over the skies of Oregon.
In order to capture images of the event, the standard windows of the Gulfstream III were replaced with optical glass providing a clear view of the eclipse. This special glass limits glare and distortion of common acrylic aircraft windows. Heaters are aimed at the windows where the imagery equipment will be used to prevent icing that could obscure a clear view of the eclipse.
Learn more about the observations of the eclipse made from this aircraft HERE.
Make sure to follow us on Tumblr for your regular dose of space: http://nasa.tumblr.com
Scientists are trying a new, interactive way to understand ocean current data with the help of high-resolution global ocean simulations. In the part of the global visualization shown, the Gulf Stream features prominently. Surface water speeds are shown ranging from 0 meters per second (dark blue) to 1.23 meters per second (cyan).
This video is running at one simulation day per second. A team from our Advanced Supercomputing (NAS) facility at our Ames Research Center has developed a new visualization tool that is being used by researchers to study the behavior of ocean currents. The new visualization tool provides high-resolution views of the entire globe at once, allowing the scientists to see new details that they had missed in previous analyses of their simulation, which was run on our Pleiades supercomputer.
For more information, visit: https://www.nasa.gov/feature/ames/scientists-explore-ocean-currents-through-supercomputer-simulations
Make sure to follow us on Tumblr for your regular dose of space: http://nasa.tumblr.com
Let Us See Jupiter Through Your Eyes

Our Juno spacecraft will fly over Jupiter’s Great Red Spot on July 10 at 10:06 p.m. EDT. This will be humanity’s first up-close and personal view of the gas giant’s iconic 10,000-mile-wide storm, which has been monitored since 1830 and possibly existing for more than 350 years.

The data collection of the Great Red Spot is part of Juno’s sixth science flyby over Jupiter’s mysterious cloud tops. Perijove (the point at which an orbit comes closest to Jupiter’s center) will be July 10 at 9:55 p.m. EDT.

At the time of perijove, Juno will be about 2,200 miles above the planet’s cloud tops. Eleven minutes and 33 seconds later…Juno will have covered another 24,713 miles and will be directly above the coiling crimson cloud tops of the Great Red Spot. The spacecraft will pass about 5,600 miles above its clouds.
When will we see images from this flyby?
During the flyby, all eight of the spacecraft’s instruments will be turned on, as well as its imager, JunoCam. Because the spacecraft will be collecting data with its Microwave Radiometer (MWR), which measures radio waves from Jupiter’s deep atmosphere, we cannot downlink information during the pass. The MWR can tell us how much water there is and how material is moving far below the cloud tops.
During the pass, all data will be stored on-board…with a downlink planned afterwards. Once the downlink begins, engineering data from the spacecraft’s instruments will come to Earth first, followed by images from JunoCam.
The unprocessed, raw images will be located HERE, on approximately July 14. Follow @NASAJuno on Twitter for updates.
Did you know you can download and process these raw images?
We invite the public to act as a virtual imaging team…participating in key steps of the process, from identifying features of interest to sharing the finished images online. After JunoCam data arrives on Earth, members of the public can process the images to create color pictures. The public also helps determine which points on the planet will be photographed. Learn more about voting on JunoCam’s next target HERE.

JunoCam has four filters: red, green, blue and near-infrared. We get red, green and blue strips on one spacecraft rotation (the spacecraft rotation rate is 2 revolutions per minute) and the near-infrared strips on the second rotation. To get the final image product, the strips must be stitched together and the colors lined up.
Anything from cropping to color enhancing to collaging is fair game. Be creative!
Submit your images to Juno_outreach@jpl.nasa.gov to be featured on the Mission Juno website!
Check out some of these citizen-scientist processed images from previous Juno orbits:

Credit: Sean Doran (More)

Credit: Amelia Carolina (More)

Credit: Michael Ranger (More)

Credit: Jason Major (More)
Make sure to follow us on Tumblr for your regular dose of space: http://nasa.tumblr.com
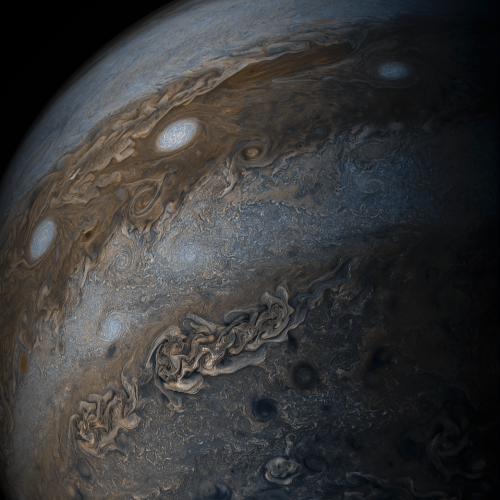
Swirling bands of light and dark clouds on Jupiter are seen in this image made by citizen scientists using data from our Juno spacecraft. Each of the alternating light and dark atmospheric bands in this image is wider than Earth, and each rages around Jupiter at hundreds of miles (km) per hour. The lighter areas are regions where gas is rising, and the darker bands are regions where gas is sinking. This image was acquired on May 19, 2017 from about 20,800 miles (33,400km) above Jupiter's cloud tops. Learn more
Credits: NASA/JPL-Caltech/SwRI/MSSS/Gerald Eichstädt /Seán Doran
Make sure to follow us on Tumblr for your regular dose of space: http://nasa.tumblr.com
We Just Identified More Than 200 New (Potential) Planets
The Kepler space telescope is our first mission capable of identifying Earth-size planets around other stars. On Monday, June 19, 2017, scientists from many countries gathered at our Ames Research Center to talk about the latest results from the spacecraft, which include the identification of more than 200 potential new worlds! Here’s what you need to know:
We found 219 new planet candidates.

All of these worlds were found in a patch of sky near the Cygnus constellation in our Milky Way galaxy. Between 2009 and 2013, Kepler searched more than 200,000 stars in the region for orbiting planets. The 219 new planet candidates are part of the more than 4,000 planet candidates and 2,300 confirmed planets Kepler has identified to date.
Ten of these worlds are like our own.

Out of the 219 new planet candidates, 10 are possibly rocky, terrestrial worlds and orbit their star in the habitable zone – the range of distances from a star where liquid water could pool on the surface of a rocky planet.
Small planets come in two sizes.

Kepler has opened up our eyes to the existence of many small worlds. It turns out a lot of these planets are either approximately 1.5 times the size of Earth or just smaller than Neptune. The cool names given to planets of these sizes? Super Earths and mini-Neptunes.
Some of the new planets could be habitable.

Water is a key ingredient to life as we know it. Many of the new planet candidates are likely to have small rocky cores enveloped by a thick atmosphere of hydrogen and helium, and some are thought to be ocean worlds. That doesn’t necessarily mean the oceans of these planets are full of water, but we can dream, can’t we?
Other Earths are out there.

Kepler’s survey has made it possible for us to measure the number of Earth-size habitable zone planets in our galaxy. Determining how many planets like our own that exist is the big question we’ll explore next.
The hunt for new planets continues.

Kepler continues to search for planets in different regions of space. With the launch of our Transiting Exoplanet Survey Satellite (TESS) and the James Webb Space Telescope (JWST) in 2018, we’re going to search for planets nearest the sun and measure the composition of their atmospheres. In the mid-2020s, we have our sights on taking a picture of small planets like Earth with our Wide-Field Infrared Survey Telescope (WFIRST).
*All images of planets are artist illustrations.
Make sure to follow us on Tumblr for your regular dose of space: http://nasa.tumblr.com
1,000 Days in Orbit: MAVEN’s Top 10 Discoveries at Mars
On June 17, our MAVEN (Mars Atmosphere and Volatile Evolution Mission) will celebrate 1,000 Earth days in orbit around the Red Planet.

Since its launch in November 2013 and its orbit insertion in September 2014, MAVEN has been exploring the upper atmosphere of Mars. MAVEN is bringing insight to how the sun stripped Mars of most of its atmosphere, turning a planet once possibly habitable to microbial life into a barren desert world.

Here’s a countdown of the top 10 discoveries from the mission so far:
10. Unprecedented Ultraviolet View of Mars

Revealing dynamic, previously invisible behavior, MAVEN was able to show the ultraviolet glow from the Martian atmosphere in unprecedented detail. Nightside images showed ultraviolet “nightglow” emission from nitric oxide. Nightglow is a common planetary phenomenon in which the sky faintly glows even in the complete absence of eternal light.
9. Key Features on the Loss of Atmosphere

Some particles from the solar wind are able to penetrate unexpectedly deep into the upper atmosphere, rather than being diverted around the planet by the Martian ionosphere. This penetration is allowed by chemical reactions in the ionosphere that turn the charged particles of the solar wind into neutral atoms that are then able to penetrate deeply.
8. Metal Ions

MAVEN made the first direct observations of a layer of metal ions in the Martian ionosphere, resulting from incoming interplanetary dust hitting the atmosphere. This layer is always present, but was enhanced dramatically by the close passage to Mars of Comet Siding Spring in October 2014.
7. Two New Types of Aurora

MAVEN has identified two new types of aurora, termed “diffuse” and “proton” aurora. Unlike how we think of most aurorae on Earth, these aurorae are unrelated to either a global or local magnetic field.
6. Cause of the Aurorae

These aurorae are caused by an influx of particles from the sun ejected by different types of solar storms. When particles from these storms hit the Martian atmosphere, they can also increase the rate of loss of gas to space, by a factor of ten or more.
5. Complex Interactions with Solar Wind

The interactions between the solar wind and the planet are unexpectedly complex. This results due to the lack of an intrinsic Martian magnetic field and the occurrence of small regions of magnetized crust that can affect the incoming solar wind on local and regional scales. The magnetosphere that results from the interactions varies on short timescales and is remarkably “lumpy” as a result.
4. Seasonal Hydrogen

After investigating the upper atmosphere of the Red Planet for a full Martian year, MAVEN determined that the escaping water does not always go gently into space. The spacecraft observed the full seasonal variation of hydrogen in the upper atmosphere, confirming that it varies by a factor of 10 throughout the year. The escape rate peaked when Mars was at its closest point to the sun and dropped off when the planet was farthest from the sun.
3. Gas Lost to Space

MAVEN has used measurements of the isotopes in the upper atmosphere (atoms of the same composition but having different mass) to determine how much gas has been lost through time. These measurements suggest that 2/3 or more of the gas has been lost to space.
2. Speed of Solar Wind Stripping Martian Atmosphere

MAVEN has measured the rate at which the sun and the solar wind are stripping gas from the top of the atmosphere to space today, along with details of the removal process. Extrapolation of the loss rates into the ancient past – when the solar ultraviolet light and the solar wind were more intense – indicates that large amounts of gas have been lost to space through time.
1. Martian Atmosphere Lost to Space

The Mars atmosphere has been stripped away by the sun and the solar wind over time, changing the climate from a warmer and wetter environment early in history to the cold, dry climate that we see today.
Maven will continue its observations and is now observing a second Martian year, looking at the ways that the seasonal cycles and the solar cycle affect the system.
For more information about MAVEN, visit: www.nasa.gov/maven
Make sure to follow us on Tumblr for your regular dose of space: http://nasa.tumblr.com
Solar System: Things to Know This Week
Mark your calendars for summer 2018: That's when we're launching a spacecraft to touch the sun.
In honor of our first-ever mission to the heart of the solar system, this week we’re delving into the life and times of this powerful yellow dwarf star.

1. Meet Parker
Parker Solar Probe, our first mission to go to the sun, is named after Eugene Parker, an American astrophysicist who first theorized that the sun constantly sends out a flow of particles and energy called the solar wind. This historic mission will explore one of the last regions of the solar system to be visited by a spacecraft and help scientists unlock answers to questions they've been pondering for more than five decades.

2. Extra SPF, Please
Parker Solar Probe will swoop within 4 million miles of the sun's surface, facing heat and radiation like no spacecraft before it. The mission will provide new data on solar activity to help us better understand our home star and its activity - information that can improve forecasts of major space-weather events that could impact life on Earth.

3. Majorly Massive
The sun is the center of our solar system and makes up 99.8 percent of the mass of the entire solar system. If the sun were as tall as a typical front door, Earth would be about the size of a nickel.
4. Different Spin
Since the sun is not a solid body, different parts of the sun rotate at different rates. At the equator, the sun spins once about every 25 days, but at its poles the sun rotates once on its axis every 36 Earth days.

5. Can't Stand on It
The sun is a star and a star doesn't have a solid surface. Rather, it's a ball of ionized gas 92.1% hydrogen (H2) and 7.8% helium (He) held together by its own gravity.
6. Center of Attention
The sun isn't a planet, so it doesn't have any moons. But, the sun is orbited by eight planets, at least five dwarf planets, tens of thousands of asteroids, and hundreds of thousands to trillions of comets and icy bodies.

7. It's Hot in There
And we mean really, really hot. The temperature at the sun's core is about 27 million degrees Fahrenheit. However, its atmosphere, the corona, can reach temperatures of 3 million degrees. (That's as if it got hotter the farther away you got from a fire, instead of cooler!) Parker Solar Probe will help scientists solve the mystery of why the corona's temperature is so much higher than the surface.

8. Travel Conditions
The sun influences the entire solar system, so studying it helps us better understand the space weather that our astronauts and spacecraft travel through.
9. Life on the Sun?
Better to admire from afar. Thanks to its hot, energetic mix of gases and plasma, the sun can't be home to living things. However, we can thank the sun for making life on Earth possible by providing the warmth and energy that supply Earth’s food chain.
10. Chance of a Lifetime
Last but not least, don't forget that the first total solar eclipse to sweep across the U.S. from coast-to-coast since 1918 is happening on August 21, 2017. Our toolkit has you need to know to about it.
Want to learn more? Read our full list of the 10 things to know this week about the solar system HERE.
Make sure to follow us on Tumblr for your regular dose of space: http://nasa.tumblr.com
Incoming! We’ve Got Science from Jupiter!
Our Juno spacecraft has just released some exciting new science from its first close flyby of Jupiter!

In case you don’t know, the Juno spacecraft entered orbit around the gas giant on July 4, 2016…about a year ago. Since then, it has been collecting data and images from this unique vantage point.

Juno is in a polar orbit around Jupiter, which means that the majority of each orbit is spent well away from the gas giant. But once every 53 days its trajectory approaches Jupiter from above its north pole, where it begins a close two-hour transit flying north to south with its eight science instruments collecting data and its JunoCam camera snapping pictures.

Space Fact: The download of six megabytes of data collected during the two-hour transit can take one-and-a-half days!

Juno and her cloud-piercing science instruments are helping us get a better understanding of the processes happening on Jupiter. These new results portray the planet as a complex, gigantic, turbulent world that we still need to study and unravel its mysteries.
So what did this first science flyby tell us? Let’s break it down...
1. Tumultuous Cyclones

Juno’s imager, JunoCam, has showed us that both of Jupiter’s poles are covered in tumultuous cyclones and anticyclone storms, densely clustered and rubbing together. Some of these storms as large as Earth!

These storms are still puzzling. We’re still not exactly sure how they formed or how they interact with each other. Future close flybys will help us better understand these mysterious cyclones.

Seen above, waves of clouds (at 37.8 degrees latitude) dominate this three-dimensional Jovian cloudscape. JunoCam obtained this enhanced-color picture on May 19, 2017, at 5:50 UTC from an altitude of 5,500 miles (8,900 kilometers). Details as small as 4 miles (6 kilometers) across can be identified in this image.

An even closer view of the same image shows small bright high clouds that are about 16 miles (25 kilometers) across and in some areas appear to form “squall lines” (a narrow band of high winds and storms associated with a cold front). On Jupiter, clouds this high are almost certainly comprised of water and/or ammonia ice.
2. Jupiter’s Atmosphere
Juno’s Microwave Radiometer is an instrument that samples the thermal microwave radiation from Jupiter’s atmosphere from the tops of the ammonia clouds to deep within its atmosphere.

Data from this instrument suggest that the ammonia is quite variable and continues to increase as far down as we can see with MWR, which is a few hundred kilometers. In the cut-out image below, orange signifies high ammonia abundance and blue signifies low ammonia abundance. Jupiter appears to have a band around its equator high in ammonia abundance, with a column shown in orange.

Why does this ammonia matter? Well, ammonia is a good tracer of other relatively rare gases and fluids in the atmosphere...like water. Understanding the relative abundances of these materials helps us have a better idea of how and when Jupiter formed in the early solar system.
This instrument has also given us more information about Jupiter’s iconic belts and zones. Data suggest that the belt near Jupiter’s equator penetrates all the way down, while the belts and zones at other latitudes seem to evolve to other structures.
3. Stronger-Than-Expected Magnetic Field

Prior to Juno, it was known that Jupiter had the most intense magnetic field in the solar system…but measurements from Juno’s magnetometer investigation (MAG) indicate that the gas giant’s magnetic field is even stronger than models expected, and more irregular in shape.

At 7.766 Gauss, it is about 10 times stronger than the strongest magnetic field found on Earth! What is Gauss? Magnetic field strengths are measured in units called Gauss or Teslas. A magnetic field with a strength of 10,000 Gauss also has a strength of 1 Tesla.

Juno is giving us a unique view of the magnetic field close to Jupiter that we’ve never had before. For example, data from the spacecraft (displayed in the graphic above) suggests that the planet’s magnetic field is “lumpy”, meaning its stronger in some places and weaker in others. This uneven distribution suggests that the field might be generated by dynamo action (where the motion of electrically conducting fluid creates a self-sustaining magnetic field) closer to the surface, above the layer of metallic hydrogen. Juno's orbital track is illustrated with the black curve.
4. Sounds of Jupiter
Juno also observed plasma wave signals from Jupiter’s ionosphere. This movie shows results from Juno's radio wave detector that were recorded while it passed close to Jupiter. Waves in the plasma (the charged gas) in the upper atmosphere of Jupiter have different frequencies that depend on the types of ions present, and their densities.
Mapping out these ions in the jovian system helps us understand how the upper atmosphere works including the aurora. Beyond the visual representation of the data, the data have been made into sounds where the frequencies and playback speed have been shifted to be audible to human ears.
5. Jovian “Southern Lights”

The complexity and richness of Jupiter’s “southern lights” (also known as auroras) are on display in this animation of false-color maps from our Juno spacecraft. Auroras result when energetic electrons from the magnetosphere crash into the molecular hydrogen in the Jovian upper atmosphere. The data for this animation were obtained by Juno’s Ultraviolet Spectrograph.

During Juno’s next flyby on July 11, the spacecraft will fly directly over one of the most iconic features in the entire solar system – one that every school kid knows – Jupiter’s Great Red Spot! If anybody is going to get to the bottom of what is going on below those mammoth swirling crimson cloud tops, it’s Juno.

Stay updated on all things Juno and Jupiter by following along on social media: Twitter | Facebook | YouTube | Tumblr
Learn more about the Juno spacecraft and its mission at Jupiter HERE.
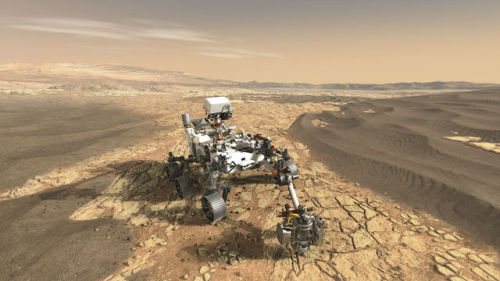
Our future Mars 2020 rover, seen here as imagined through the eyes of an artist, will search for signs of past microbial life. The mission will take the next step in exploring the Red Planet by not only seeking signs of habitable conditions on Mars in the ancient past, but also searching for signs of past microbial life itself.
The Mars 2020 rover introduces a drill that can collect core samples of the most promising rocks and soils and set them aside on the surface of Mars. A future mission could potentially return these samples to Earth. Mars 2020 is targeted for launch in July/August 2020, aboard an Atlas V 541 rocket from Space Launch Complex 41 at Cape Canaveral Air Force Station in Florida. Learn more.
Make sure to follow us on Tumblr for your regular dose of space: http://nasa.tumblr.com