
57 posts
Latest Posts by jupyterjones - Page 2


The 21 Card Trick created in Python.
See how it works and read a little more about it here: [x]
Feel free to ask any questions you may have. :)
There are 27 straight lines on a smooth cubic surface (always; for real!)
This talk was given by Theodosios Douvropoulos at our junior colloquium.
I always enjoy myself at Theo’s talks, but he has picked up Vic’s annoying habit of giving talks that are nearly impossible to take good notes on. This talk was at least somewhat elementary, which means that I could at least follow it while being completely unsure of what to write down ;)
——
A cubic surface is a two-dimensional surface in three dimensions which is defined by a cubic polynomial. This statement has to be qualified somewhat if you want to do work with these objects, but for the purpose of listening to a talk, this is all you really need.
The amazing theorem about smooth cubic surfaces was proven by Arthur Cayley in 1849, which is that they contain 27 lines. To be clear, “line” in this context means an actual honest-to-god straight line, and by “contain” we mean that the entire line sits inside the surface, like yes all of it, infinitely far in both directions, without distorting it at all.

(source)
[ Okay, fine, you have to make some concession here: the field has to be algebraically closed and the line is supposed to be a line over that field. And $\Bbb R$ is not algebraically closed, so a ‘line’ really means a complex line, but that’s not any less amazing because it’s still an honest, straight, line. ]
This theorem is completely unreasonable for three reasons. First of all, the fact that any cubic surface contains any (entire) lines at all is kind of stunning. Second, the fact that the number of lines that it contains is finite is it’s own kind of cray. And finally, every single cubic surface has the SAME NUMBER of lines?? Yes! always; for real!
All of these miracles have justifications, and most of them are kind of technical. Theo spent a considerable amount of time talking about the second one, but after scribbling on my notes for the better part of an hour, I can’t make heads or tails of them. So instead I’m going to talk about blowups.
I mentioned blowups in the fifth post of the sequence on Schubert varieties, and I dealt with it fairly informally there, but Theo suggested a more formal but still fairly intuitive way of understanding blowups at a point. The idea is that we are trying to replace the point with a collection of points, one for each unit tangent vector at the original point. In particular, a point on any smooth surface has a blowup that looks like a line, and hence the blowup in a neighborhood of the point looks like this:

(source)
Here is another amazing fact about cubic surfaces: all of them can be realized as a plane— just an ordinary, flat (complex) 2D plane— which has been blown up at exactly six points. These points have to be “sufficiently generic”; much like in the crescent configuration situation, you need that no two points lie on the same line, and the six points do not all lie on a conic curve (a polynomial of degree 2).
In fact, it’s possible, using this description to very easily recover 21 of the 27 lines. Six of the lines come from the blowups themselves, since points blow up into lines. Another fifteen of them come from the lines between any two locations of blowup. This requires a little bit of work: you can see in the picture that the “horizontal directions” of the blowup are locally honest lines. Although most of these will become distorted near the other blowups, precisely one will not: the height corresponding to the tangent vector pointing directly at the other blowup point.
The remaining six points are can also be understood from this picture: they come from the image of the conic passing through five of the blowup points. I have not seen a convincing elementary reason why this should be true; the standard proof is via a Chow ring computation. If you know anything about Chow rings, you know that I am not about to repeat that computation right here.
This description is nice because it not only tells us how many lines there are, but also it roughly tells us how the lines intersect each other. I say “roughly” because you do have to know a little more about what’s going on with those conics a little more precisely. In particular, it is possible for three lines on a cubic surface to intersect at a single point, but this does not always happen.
I’ll conclude in the same way that Theo did, with a rushed comment about the fact that “27 lines on a cubic” is one part of a collection of relations and conjectured relations that Arnold called the trinities. Some of these trinities are more… shall we say… substantiated than others… but in any case, the whole mess is Laglandsian in scope and unlikely even to be stated rigorously, much less settled, in our lifetimes. But it makes for interesting reading and good fodder for idle speculation :)
A sand pendulum that creates a beautiful pattern only by its movement.
But why does the ellipse change shape?
The pattern gets smaller because energy is not conserved (and in fact decreases) in the system. The mass in the pendulum gets smaller and the center of mass lowers as a function of time. Easy as that, an amazing pattern arises through the laws of physics.

This shows that the probability of a random variable is maximum at the average and diminishes as one goes away from it, eventually leading to a bell-curve.

The simple harmonic oscillator
Anonymous asked: Please explain the intuition of solving the SHM equation.
Okay Anon! Here you go, this is my rendition.
The problem
You have a mass suspended on a spring. We want to know where the mass will be at any instant of time.
Describe the motion of the mass

The physical solution
Now before we get on to the math, let us first visualize the motion by attaching a spray paint bottle as the mass.

Oh, wait that seems like a function that we are familiar with - The sinusoid.

Without even having to write down a single equation, we have found out the solution to our problem. The motion that is traced by the mass is a sinusoid.
But what do I mean by a sinusoid ?
If you took the plotted paper and tried to create that function with the help of sum of polynomials i.e x, x2, x3 … Now you this what it would like :

By taking an infinite of these polynomial sums you get the function Since this series of polynomial occurs a lot, its given the name - sine.

I hope this shed some light on the intuition of the SHM equation. Have fun!


Geometry at work: Maxwell, Escher and Einstein
Maxwell’s diagram
from the 1821 “A Philosophical Magazine”, showing the rotative vortexes of electromagnetic forces, represented by hexagons and the inactive spaces between them
The impossible cube
invented in 1958, as an inspiration for his Belvedere litography.
Geometry of space-time
The three dimensions of space and the dimension of time give shape to the fourth, that of space-time.


#beingacomputerprogrammingmajor : Testing out html scripts on Pokemon Go and finding out it actually works.

Hey guys, I’m observing a high school class and was looking at a textbook, and learned that irrationals are closed under addition! Super cool, who knew!
How Do Hurricanes Form?
Hurricanes are the most violent storms on Earth. People call these storms by other names, such as typhoons or cyclones, depending on where they occur.

The scientific term for ALL of these storms is tropical cyclone. Only tropical cyclones that form over the Atlantic Ocean or eastern and central Pacific Ocean are called “hurricanes.”

Whatever they are called, tropical cyclones all form the same way.
Tropical cyclones are like giant engines that use warm, moist air as fuel. That is why they form only over warm ocean waters near the equator. This warm, moist air rises and condenses to form clouds and storms.

As this warmer, moister air rises, there’s less air left near the Earth’s surface. Essentially, as this warm air rises, this causes an area of lower air pressure below.

This starts the ‘engine’ of the storm. To fill in the low pressure area, air from surrounding areas with higher air pressure pushes in. That “new” air near the Earth’s surface also gets heated by the warm ocean water so it also gets warmer and moister and then it rises.

As the warm air continues to rise, the surrounding air swirls in to take its place. The whole system of clouds and wind spins and grows, fed by the ocean’s heat and water evaporating from the surface.
As the storm system rotates faster and faster, an eye forms in the center. It is vey calm and clear in the eye, with very low air pressure.

Tropical cyclones usually weaken when they hit land, because they are no longer being “fed” by the energy from the warm ocean waters. However, when they move inland, they can drop many inches of rain causing flooding as well as wind damage before they die out completely.
There are five types, or categories, of hurricanes. The scale of categories is called the Saffir-Simpson Hurricane Scale and they are based on wind speed.

How Does NASA Study Hurricanes?
Our satellites gather information from space that are made into pictures. Some satellite instruments measure cloud and ocean temperatures. Others measure the height of clouds and how fast rain is falling. Still others measure the speed and direction of winds.

We also fly airplanes into and above hurricanes. The instruments aboard planes gather details about the storm. Some parts are too dangerous for people to fly into. To study these parts, we use airplanes that operate without people.
Learn more about this and other questions by exploring NASA Space Place and the NASA/NOAA SciJinks that offer explanations of science topics for school kids.
Make sure to follow us on Tumblr for your regular dose of space: http://nasa.tumblr.com.
Credits: NASA Space Place & NASA/NOAA SciJinks
The Sun Just Released the Most Powerful Flare of this Solar Cycle
The Sun released two significant solar flares on Sept. 6, including one that clocked in as the most powerful flare of the current solar cycle.
The solar cycle is the approximately 11-year-cycle during which the Sun’s activity waxes and wanes. The current solar cycle began in December 2008 and is now decreasing in intensity and heading toward solar minimum, expected in 2019-2020. Solar minimum is a phase when solar eruptions are increasingly rare, but history has shown that they can nonetheless be intense.

Footage of the Sept. 6 X2.2 and X9.3 solar flares captured by the Solar Dynamics Observatory in extreme ultraviolet light (131 angstrom wavelength)
Our Solar Dynamics Observatory satellite, which watches the Sun constantly, captured images of both X-class flares on Sept. 6.
Solar flares are classified according to their strength. X-class denotes the most intense flares, followed by M-class, while the smallest flares are labeled as A-class (near background levels) with two more levels in between. Similar to the Richter scale for earthquakes, each of the five levels of letters represents a 10-fold increase in energy output.
The first flare peaked at 5:10 a.m. EDT, while the second, larger flare, peaked at 8:02 a.m. EDT.

Footage of the Sept. 6 X2.2 and X9.3 solar flares captured by the Solar Dynamics Observatory in extreme ultraviolet light (171 angstrom wavelength) with Earth for scale
Solar flares are powerful bursts of radiation. Harmful radiation from a flare cannot pass through Earth’s atmosphere to physically affect humans on the ground, however — when intense enough — they can disturb Earth’s atmosphere in the layer where GPS and communications signals travel.
Both Sept. 6 flares erupted from an active region labeled AR 2673. This area also produced a mid-level solar flare on Sept. 4, 2017. This flare peaked at 4:33 p.m. EDT, and was about a tenth the strength of X-class flares like those measured on Sept. 6.

Footage of the Sept. 4 M5.5 solar flare captured by the Solar Dynamics Observatory in extreme ultraviolet light (131 angstrom wavelength)
This active region continues to produce significant solar flares. There were two flares on the morning of Sept. 7 as well.
For the latest updates and to see how these events may affect Earth, please visit NOAA’s Space Weather Prediction Center at http://spaceweather.gov, the U.S. government’s official source for space weather forecasts, alerts, watches and warnings.
Follow @NASASun on Twitter and NASA Sun Science on Facebook to keep up with all the latest in space weather research.
Make sure to follow us on Tumblr for your regular dose of space: http://nasa.tumblr.com.
Cassini Spacecraft: Top Discoveries
Our Cassini spacecraft has been exploring Saturn, its stunning rings and its strange and beautiful moons for more than a decade.

Having expended almost every bit of the rocket propellant it carried to Saturn, operators are deliberately plunging Cassini into the planet to ensure Saturn’s moons will remain pristine for future exploration – in particular, the ice-covered, ocean-bearing moon Enceladus, but also Titan, with its intriguing pre-biotic chemistry.
Let’s take a look back at some of Cassini’s top discoveries:
Titan

Under its shroud of haze, Saturn’s planet-sized moon Titan hides dunes, mountains of water ice and rivers and seas of liquid methane. Of the hundreds of moons in our solar system, Titan is the only one with a dense atmosphere and large liquid reservoirs on its surface, making it in some ways more like a terrestrial planet.

Both Earth and Titan have nitrogen-dominated atmospheres – over 95% nitrogen in Titan’s case. However, unlike Earth, Titan has very little oxygen; the rest of the atmosphere is mostly methane and traced amounts of other gases, including ethane.

There are three large seas, all located close to the moon’s north pole, surrounded by numerous smaller lakes in the northern hemisphere. Just one large lake has been found in the southern hemisphere.
Enceladus

The moon Enceladus conceals a global ocean of salty liquid water beneath its icy surface. Some of that water even shoots out into space, creating an immense plume!

For decades, scientists didn’t know why Enceladus was the brightest world in the solar system, or how it related to Saturn’s E ring. Cassini found that both the fresh coating on its surface, and icy material in the E ring originate from vents connected to a global subsurface saltwater ocean that might host hydrothermal vents.

With its global ocean, unique chemistry and internal heat, Enceladus has become a promising lead in our search for worlds where life could exist.
Iapetus

Saturn’s two-toned moon Iapetus gets its odd coloring from reddish dust in its orbital path that is swept up and lands on the leading face of the moon.

The most unique, and perhaps most remarkable feature discovered on Iapetus in Cassini images is a topographic ridge that coincides almost exactly with the geographic equator. The physical origin of the ridge has yet to be explained…

It is not yet year whether the ridge is a mountain belt that has folded upward, or an extensional crack in the surface through which material from inside Iapetus erupted onto the surface and accumulated locally.
Saturn’s Rings

Saturn’s rings are made of countless particles of ice and dust, which Saturn’s moons push and tug, creating gaps and waves.

Scientists have never before studied the size, temperature, composition and distribution of Saturn’s rings from Saturn obit. Cassini has captured extraordinary ring-moon interactions, observed the lowest ring-temperature ever recorded at Saturn, discovered that the moon Enceladus is the source for Saturn’s E ring, and viewed the rings at equinox when sunlight strikes the rings edge-on, revealing never-before-seen ring features and details.
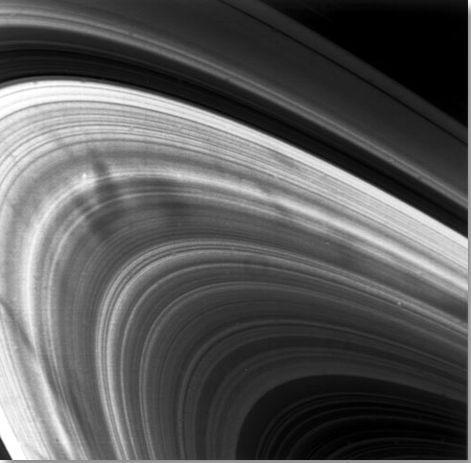
Cassini also studied features in Saturn’s rings called “spokes,” which can be longer than the diameter of Earth. Scientists think they’re made of thin icy particles that are lifted by an electrostatic charge and only last a few hours.
Auroras

The powerful magnetic field that permeates Saturn is strange because it lines up with the planet’s poles. But just like Earth’s field, it all creates shimmering auroras.

Auroras on Saturn occur in a process similar to Earth’s northern and southern lights. Particles from the solar wind are channeled by Saturn’s magnetic field toward the planet’s poles, where they interact with electrically charged gas (plasma) in the upper atmosphere and emit light.
Turbulent Atmosphere

Saturn’s turbulent atmosphere churns with immense storms and a striking, six-sided jet stream near its north pole.

Saturn’s north and south poles are also each beautifully (and violently) decorated by a colossal swirling storm. Cassini got an up-close look at the north polar storm and scientists found that the storm’s eye was about 50 times wider than an Earth hurricane’s eye.

Unlike the Earth hurricanes that are driven by warm ocean waters, Saturn’s polar vortexes aren’t actually hurricanes. They’re hurricane-like though, and even contain lightning. Cassini’s instruments have ‘heard’ lightning ever since entering Saturn orbit in 2004, in the form of radio waves. But it wasn’t until 2009 that Cassini’s cameras captured images of Saturnian lighting for the first time.

Cassini scientists assembled a short video of it, the first video of lightning discharging on a planet other than Earth.

Cassini’s adventure will end soon because it’s almost out of fuel. So to avoid possibly ever contaminating moons like Enceladus or Titan, on Sept. 15 it will intentionally dive into Saturn’s atmosphere.

The spacecraft is expected to lose radio contact with Earth within about one to two minutes after beginning its decent into Saturn’s upper atmosphere. But on the way down, before contact is lost, eight of Cassini’s 12 science instruments will be operating! More details on the spacecraft’s final decent can be found HERE.
Make sure to follow us on Tumblr for your regular dose of space: http://nasa.tumblr.com
Calculating the surface area of a sphere. Found on Imgur.
Everyone who reblogs this will get a pick-me-up in their ask box.
Every. Single. One. Of. You.
How is geometry entangled in the fabric of the Universe?
Geometry can be seen in action in all scales of the Universe, be it astronomical – in the orbital resonance of the planets for example, be it at molecular levels, in how crystals take their perfect structures. But going deeper and deeper into the fabric of the material world, we find that at quantum scale, geometry is a catalyst for many of the laws of quantum-physics and even definitions of reality.
Take for example the research made by Duncan Haldane, John Michael Kosterlitz and David Thouless, the winners of the 2016 Nobel prize in physics. By using geometry and topology they understood how exotic forms of matter take shape based on the effects of the quantum mechanics. Using techniques borrowed from geometry and topology, they studied the changes between states of matter (from plasma to gas, from gas to liquid and from liquid to solid) being able to generate a set of rules that explain different types of properties and behaviors of matter. Furthermore, by coming across a new type of symmetry patterns in quantum states that can influence those behaviors or even create new exotic types of matter, they provided new meaning and chance in using geometry as a study of “the real”.
If the Nobel Prize winners used abstract features of geometry to define physical aspects of matter, more tangible properties of geometry can be used to define other less tangible aspects of reality, like time or causality. In relativity, 3d space and 1d time become a single 4d entity called “space-time”, a dimension perceived through the eye of a space-time traveler. When an infinite number of travelers are brought into the equation, the numbers are adding up fast and, to see how for example, a space-time of a traveler looks for another traveler, we can use geometric diagrams of these equations. By tracing what a traveler “sees” in the space-time dimension and assuming that we all see the same speed of light, the intersection points of view between a stationary traveler and a moving one give a hyperbola that represents specific locations of space-time events seen by both travelers, no matter of their reference frame. These intersections represent a single value for the space-time interval, proving that the space-time dimension is dependent of the geometry given by the causality hyperbola.
If the abstract influence of geometry on the dimensions of reality isn’t enough, take for example one of the most interesting experiments of quantum-physics, the double-split experiment, were wave and particle functions are simultaneously proven to be active in light or matter. When a stream of photons is sent through a slit against a wall, the main expectation is that each photon will strike the wall in a straight line. Instead, the photons are rearranged by a specific type of patterns, called diffraction patterns, a behavior mostly visible for small particles like electrons, neutrons, atoms and small molecules, because of their short wavelength.

Two slits diffraction pattern by a plane wave. Animation by Fu-Kwun Hwang
The wave-particle duality is a handful, since it is a theory that has worked well in physics but with its meaning or representation never been satisfactorily resolved. Perhaps future experiments that will involve more abstract roles of geometry in quantum fields, like in the case of the Nobel prize winners, will develop new answers to how everything functions at these small scales of matter.
In this direction, Garret Lissi tries to explain how everything works, especially at quantum levels, by uniting all the forces of the Universe, its fibers and particles, into a 8 dimensions geometric structure. He suggests that each dot, or reference, in space-time has a shape, called fibre, attributed to each type of particle. Thus, a separate layer of space is created, parallel to the one we can perceive, given by these shapes and their interactions. Although the theory received also good reviews but also a widespread skepticism, its attempt to describe all known fundamental aspects of physics into one possible theory of everything is laudable. And proving that with laws and theories of geometry is one step closer to a Universal Geometry theory.
Permutations
Figuring out how to arrange things is pretty important.
Like, if we have the letters {A,B,C}, the six ways to arrange them are: ABC ACB BAC BCA CAB CBA
And we can say more interesting things about them (e.g. Combinatorics) another great extension is when we get dynamic
Like, if we go from ABC to ACB, and back…

We can abstract away from needing to use individual letters, and say these are both “switching the 2nd and 3rd elements,” and it is the same thing both times.
Each of these switches can be more complicated than that, like going from ABCDE to EDACB is really just 1->3->4->2->5->1, and we can do it 5 times and cycle back to the start

We can also have two switches happening at once, like 1->2->3->1 and 4->5->4, and this cycles through 6 times to get to the start.

Then, let’s extend this a bit further.
First, let’s first get a better notation, and use (1 2 3) for what I called 1->2->3->1 before.
Let’s show how we can turn these permutations into a group.
Then, let’s say the identity is just keeping things the same, and call it id.
And, this repeating thing can be extended into making the group combiner: doing one permutation and then the other. For various historical reasons, the combination of permutation A and then permutation B is B·A.
This is closed, because permuting all the things and then permuting them again still keeps 1 of all the elements in an order.
Inverses exist, because you just need to put everything from the new position into the old position to reverse it.
Associativity will be left as an exercise to the reader (read: I don’t want to prove it)

Interesting submission rk1232! Thanks for the heads up! :D :D
Regarding Fractals and Non-Integral Dimensionality
Alright, I know it’s past midnight (at least it is where I am), but let’s talk about fractal geometry.
Fractals
If you don’t know what fractals are, they’re essentially just any shape that gets rougher (or has more detail) as you zoom in, rather than getting smoother. Non-fractals include easy geometric shapes like squares, circles, and triangles, while fractals include more complex or natural shapes like the coast of Great Britain, Sierpinski’s Triangle, or a Koch Snowflake.

Fractals, in turn, can be broken down further. Some fractals are the product of an iterative process and repeat smaller versions of themselves throughout them. Others are more natural and just happen to be more jagged.

Fractals and Non-Integral Dimensionality
Now that we’ve gotten the actual explanation of what fractals are out of the way, let’s talk about their most interesting property: non-integral dimensionality. The idea that fractals do not actually have an integral dimension was originally thought up by this guy, Benoit Mandelbrot.

He studied fractals a lot, even finding one of his own: the Mandelbrot Set. The important thing about this guy is that he realized that fractals are interesting when it comes to defining their dimension. Most regular shapes can have their dimension found easily: lines with their finite length but no width or height; squares with their finite length and width but no height; and cubes with their finite length, width, and height. Take note that each dimension has its own measure. The deal with many fractals is that they can’t be measured very easily at all using these terms. Take Sierpinski’s triangle as an example.

Is this shape one- or two-dimensional? Many would say two-dimensional from first glance, but the same shape can be created using a line rather than a triangle.

So now it seems a bit more tricky. Is it one-dimensional since it can be made out of a line, or is it two-dimensional since it can be made out of a triangle? The answer is neither. The problem is that, if we were to treat it like a two-dimensional object, the measure of its dimension (area) would be zero. This is because we’ve technically taken away all of its area by taking out smaller and smaller triangles in every available space. On the other hand, if we were to treat it like a one-dimensional object, the measure of its dimension (length) would be infinity. This is because the line keeps getting longer and longer to stretch around each and every hole, of which there are an infinite number. So now we run into a problem: if it’s neither one- nor two-dimensional, then what is its dimensionality? To find out, we can use non-fractals
Measuring Integral Dimensions and Applying to Fractals
Let’s start with a one-dimensional line. The measure for a one-dimensional object is length. If we were to scale the line down by one-half, what is the fraction of the new length compared to the original length?

The new length of each line is one-half the original length.
Now let’s try the same thing for squares. The measure for a two-dimensional object is area. If we were to scale down a square by one-half (that is to say, if we were to divide the square’s length in half and divide its width in half), what is the fraction of the new area compared to the original area?

The new area of each square is one-quarter the original area.
If we were to try the same with cubes, the volume of each new cube would be one-eighth the original volume of a cube. These fractions provide us with a pattern we can work with.
In one dimension, the new length (one-half) is equal to the scaling factor (one-half) put to the first power (given by it being one-dimensional).
In two dimensions, the new area (one-quarter) is equal to the scaling factor (one-half) put to the second power (given by it being two-dimensional).
In three dimensions, the same pattern follows suit, in which the new volume (one-eighth) is equivalent to the scaling factor (one-half) put to the third power.
We can infer from this trend that the dimension of an object could be (not is) defined as the exponent fixed to the scaling factor of an object that determines the new measure of the object. To put it in mathematical terms:

Examples of this equation would include the one-dimensional line, the two-dimensional square, and the three-dimensional cube:
½ = ½^1
¼ = ½^2
1/8 = ½^3
Now this equation can be used to define the dimensionality of a given fractal. Let’s try Sierpinski’s Triangle again.

Here we can see that the triangle as a whole is made from three smaller versions of itself, each of which is scaled down by half of the original (this is proven by each side of the smaller triangles being half the length of the side of the whole triangle). So now we can just plug in the numbers to our equation and leave the dimension slot blank.
1/3 = ½^D
To solve for D, we need to know what power ½ must be put to in order to get 1/3. To do this, we can use logarithms (quick note: in this case, we can replace ½ with 2 and 1/3 with 3).
log_2(3) = roughly 1.585
So we can conclude that Sierpinski’s triangle is 1.585-dimensional. Now we can repeat this process with many other fractals. For example, this Sierpinski-esque square:

It’s made up of eight smaller versions of itself, each of which is scaled down by one-third. Plugging this into the equation, we get
1/8 = 1/3^D
log_3(8) = roughly 1.893
So we can conclude that this square fractal is 1.893-dimensional.
We can do this on this cubic version of it, too:

This cube is made up of 20 smaller versions of itself, each of which is scaled down by 1/3.
1/20 = 1/3^D
log_3(20) = roughly 2.727
So we can conclude that this fractal is 2.727-dimensional.


Geometry and Divnity
Omnipresence
The Point
Divinity is present in every aspect of natural order and causality dimensions. It is part of the material world through various holistic and messianic incarnations, being at the same time a component of human thought and action. This kind of omnipresence is logical possible through the classical definition of a geometrical point, that is part of the entire space but does not occupy any of it.
Trinity
The Borromean Rings
While distinct and at the same time considered to be one in all else, the Three Divine Persons are sometimes represented by the Borromean Rings: no two of the three rings are linked with each other,but nonetheless all three are linked.
Divinity
Harmonic Proportion
The harmonic state of an element is associated with beauty, given by the equilibrium of its components. Nature is being perceived as beautiful, and its creator as good - inevitable and inherently in harmony with its creation.


![How To Draw A Regular Pentagon [x]](https://64.media.tumblr.com/e789070555deb967c4b2323363be07b9/tumblr_opd8xi3HCJ1vnq1cro1_500.gif)

People think coding / debugging means highly concentrated furious typing, but mostly it’s just angrily staring at the screen for long periods of time waiting for the problem to solve itself